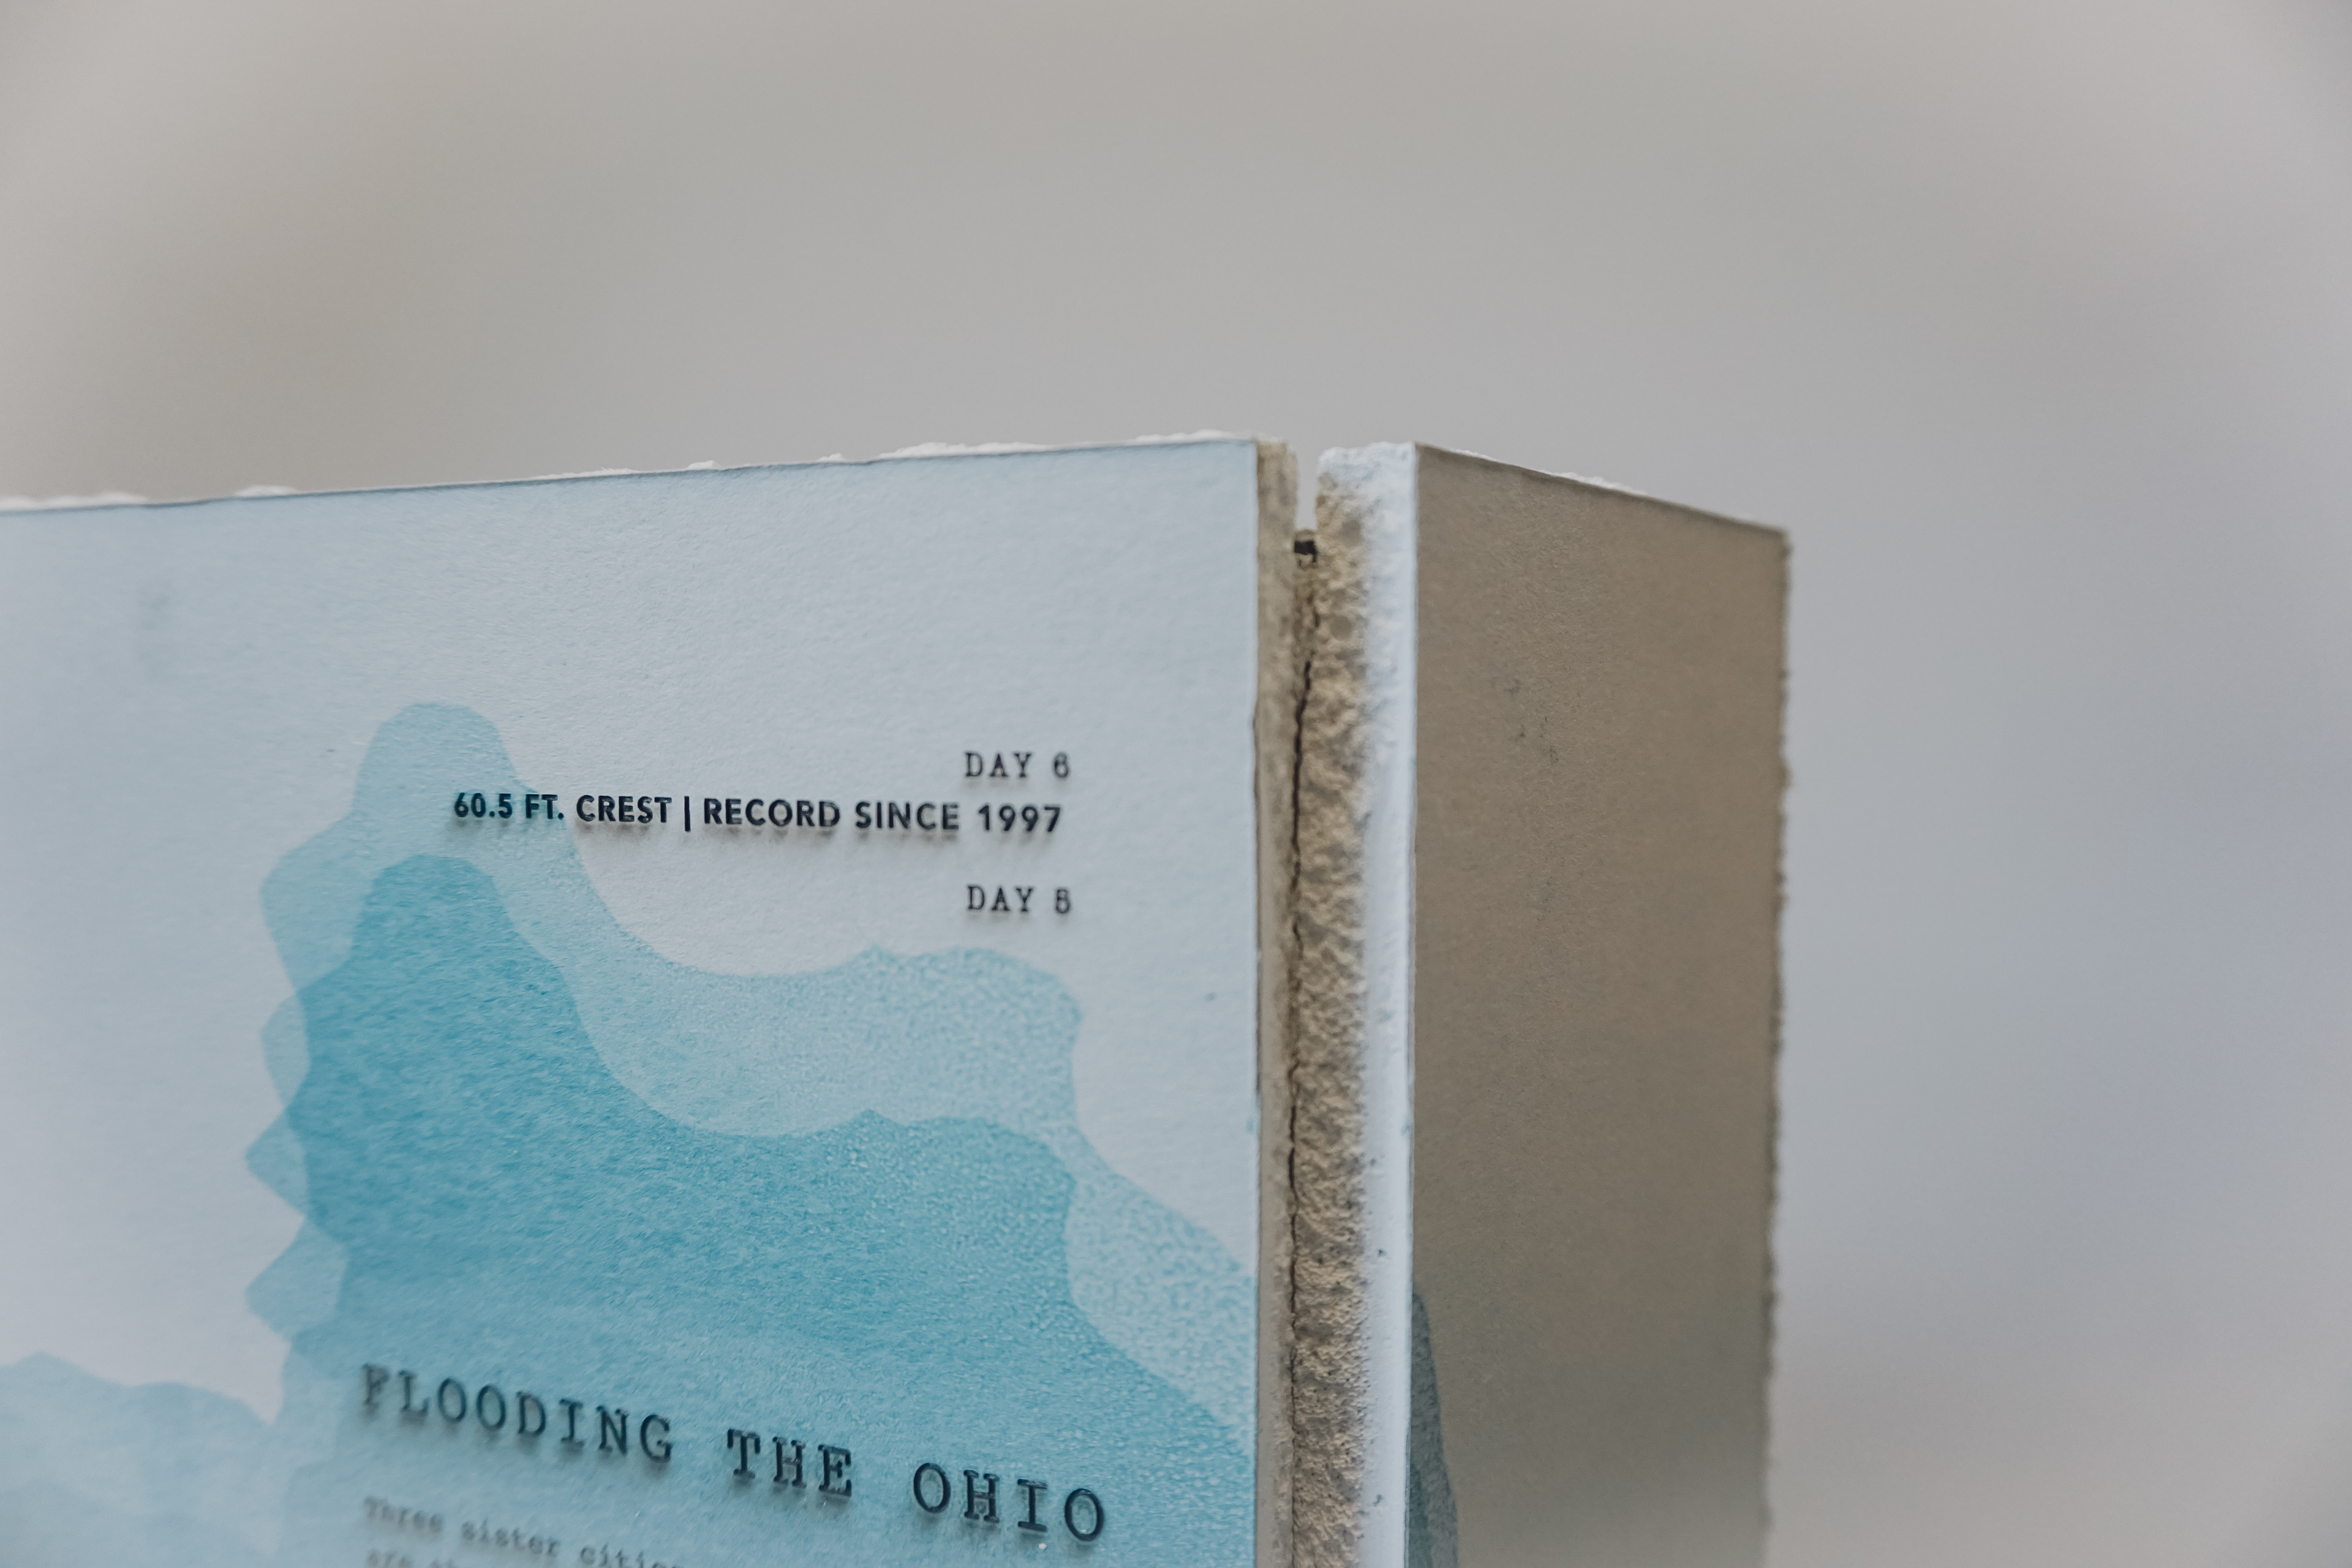
Collecting and visualizing Ohio River flood data in a nostalgic, meaningful way
How may I visualize data in a way that evokes nostalgic meaning? How may I utilize materiality and process to create a tangible experience?
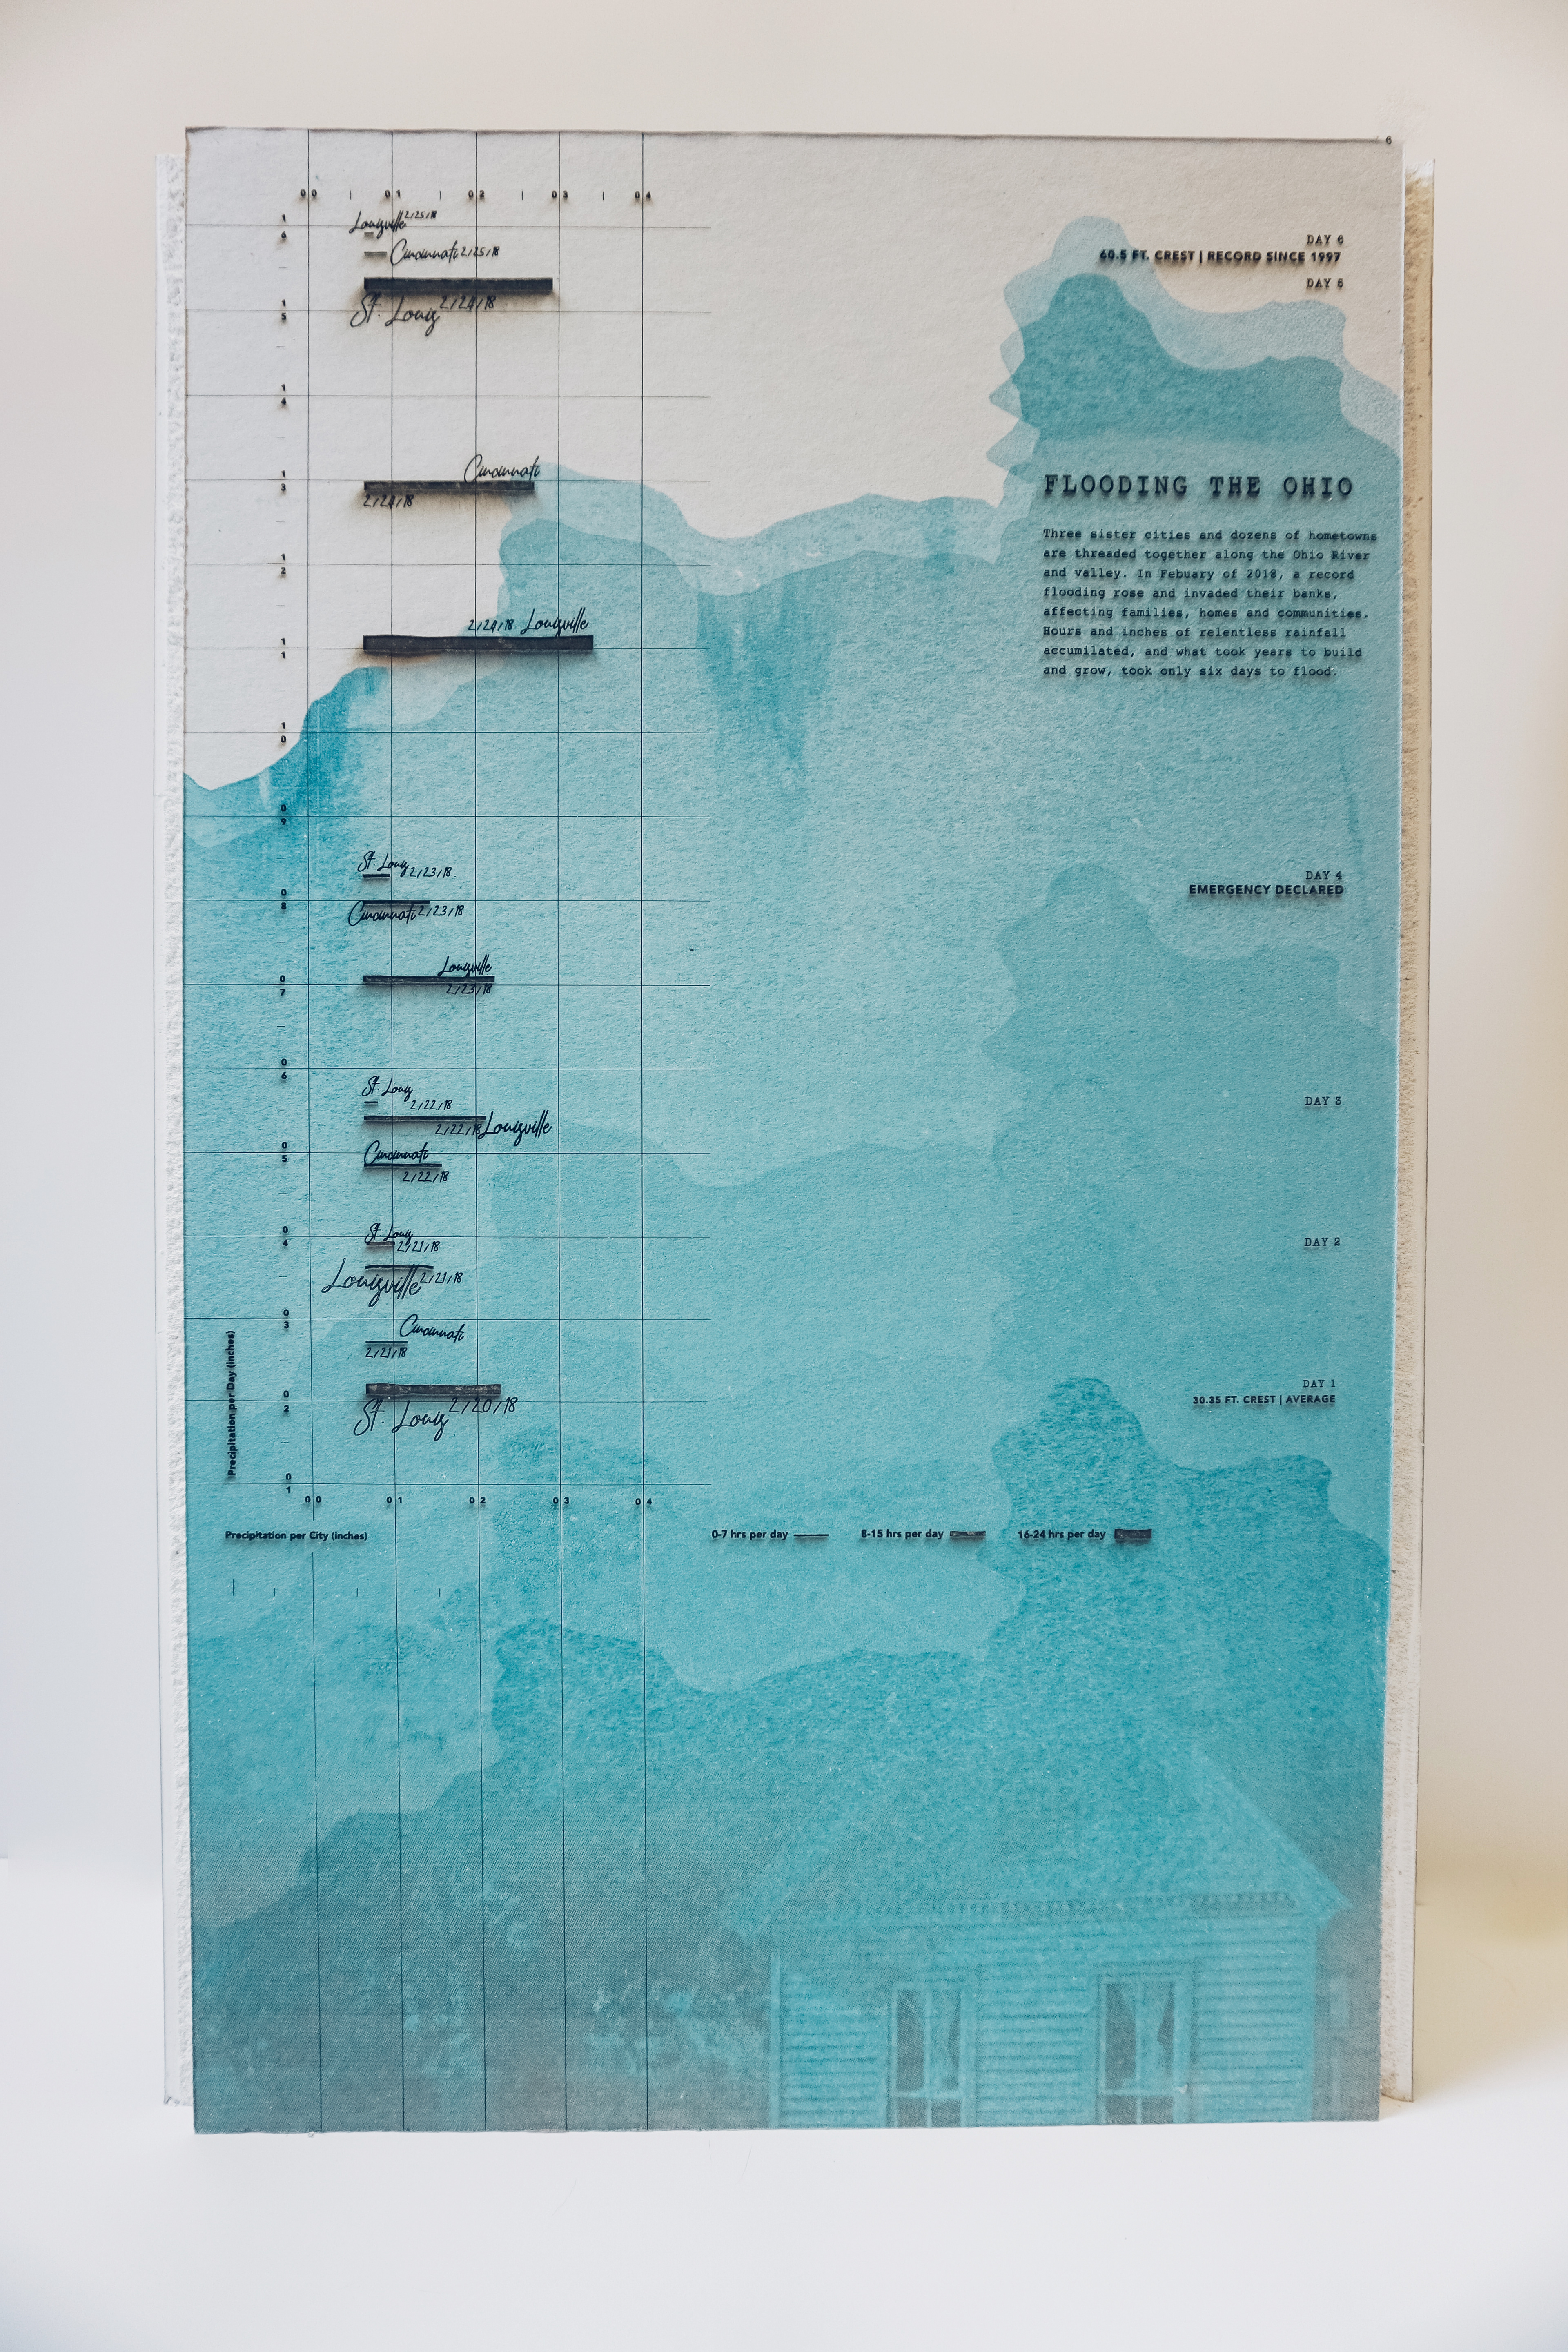
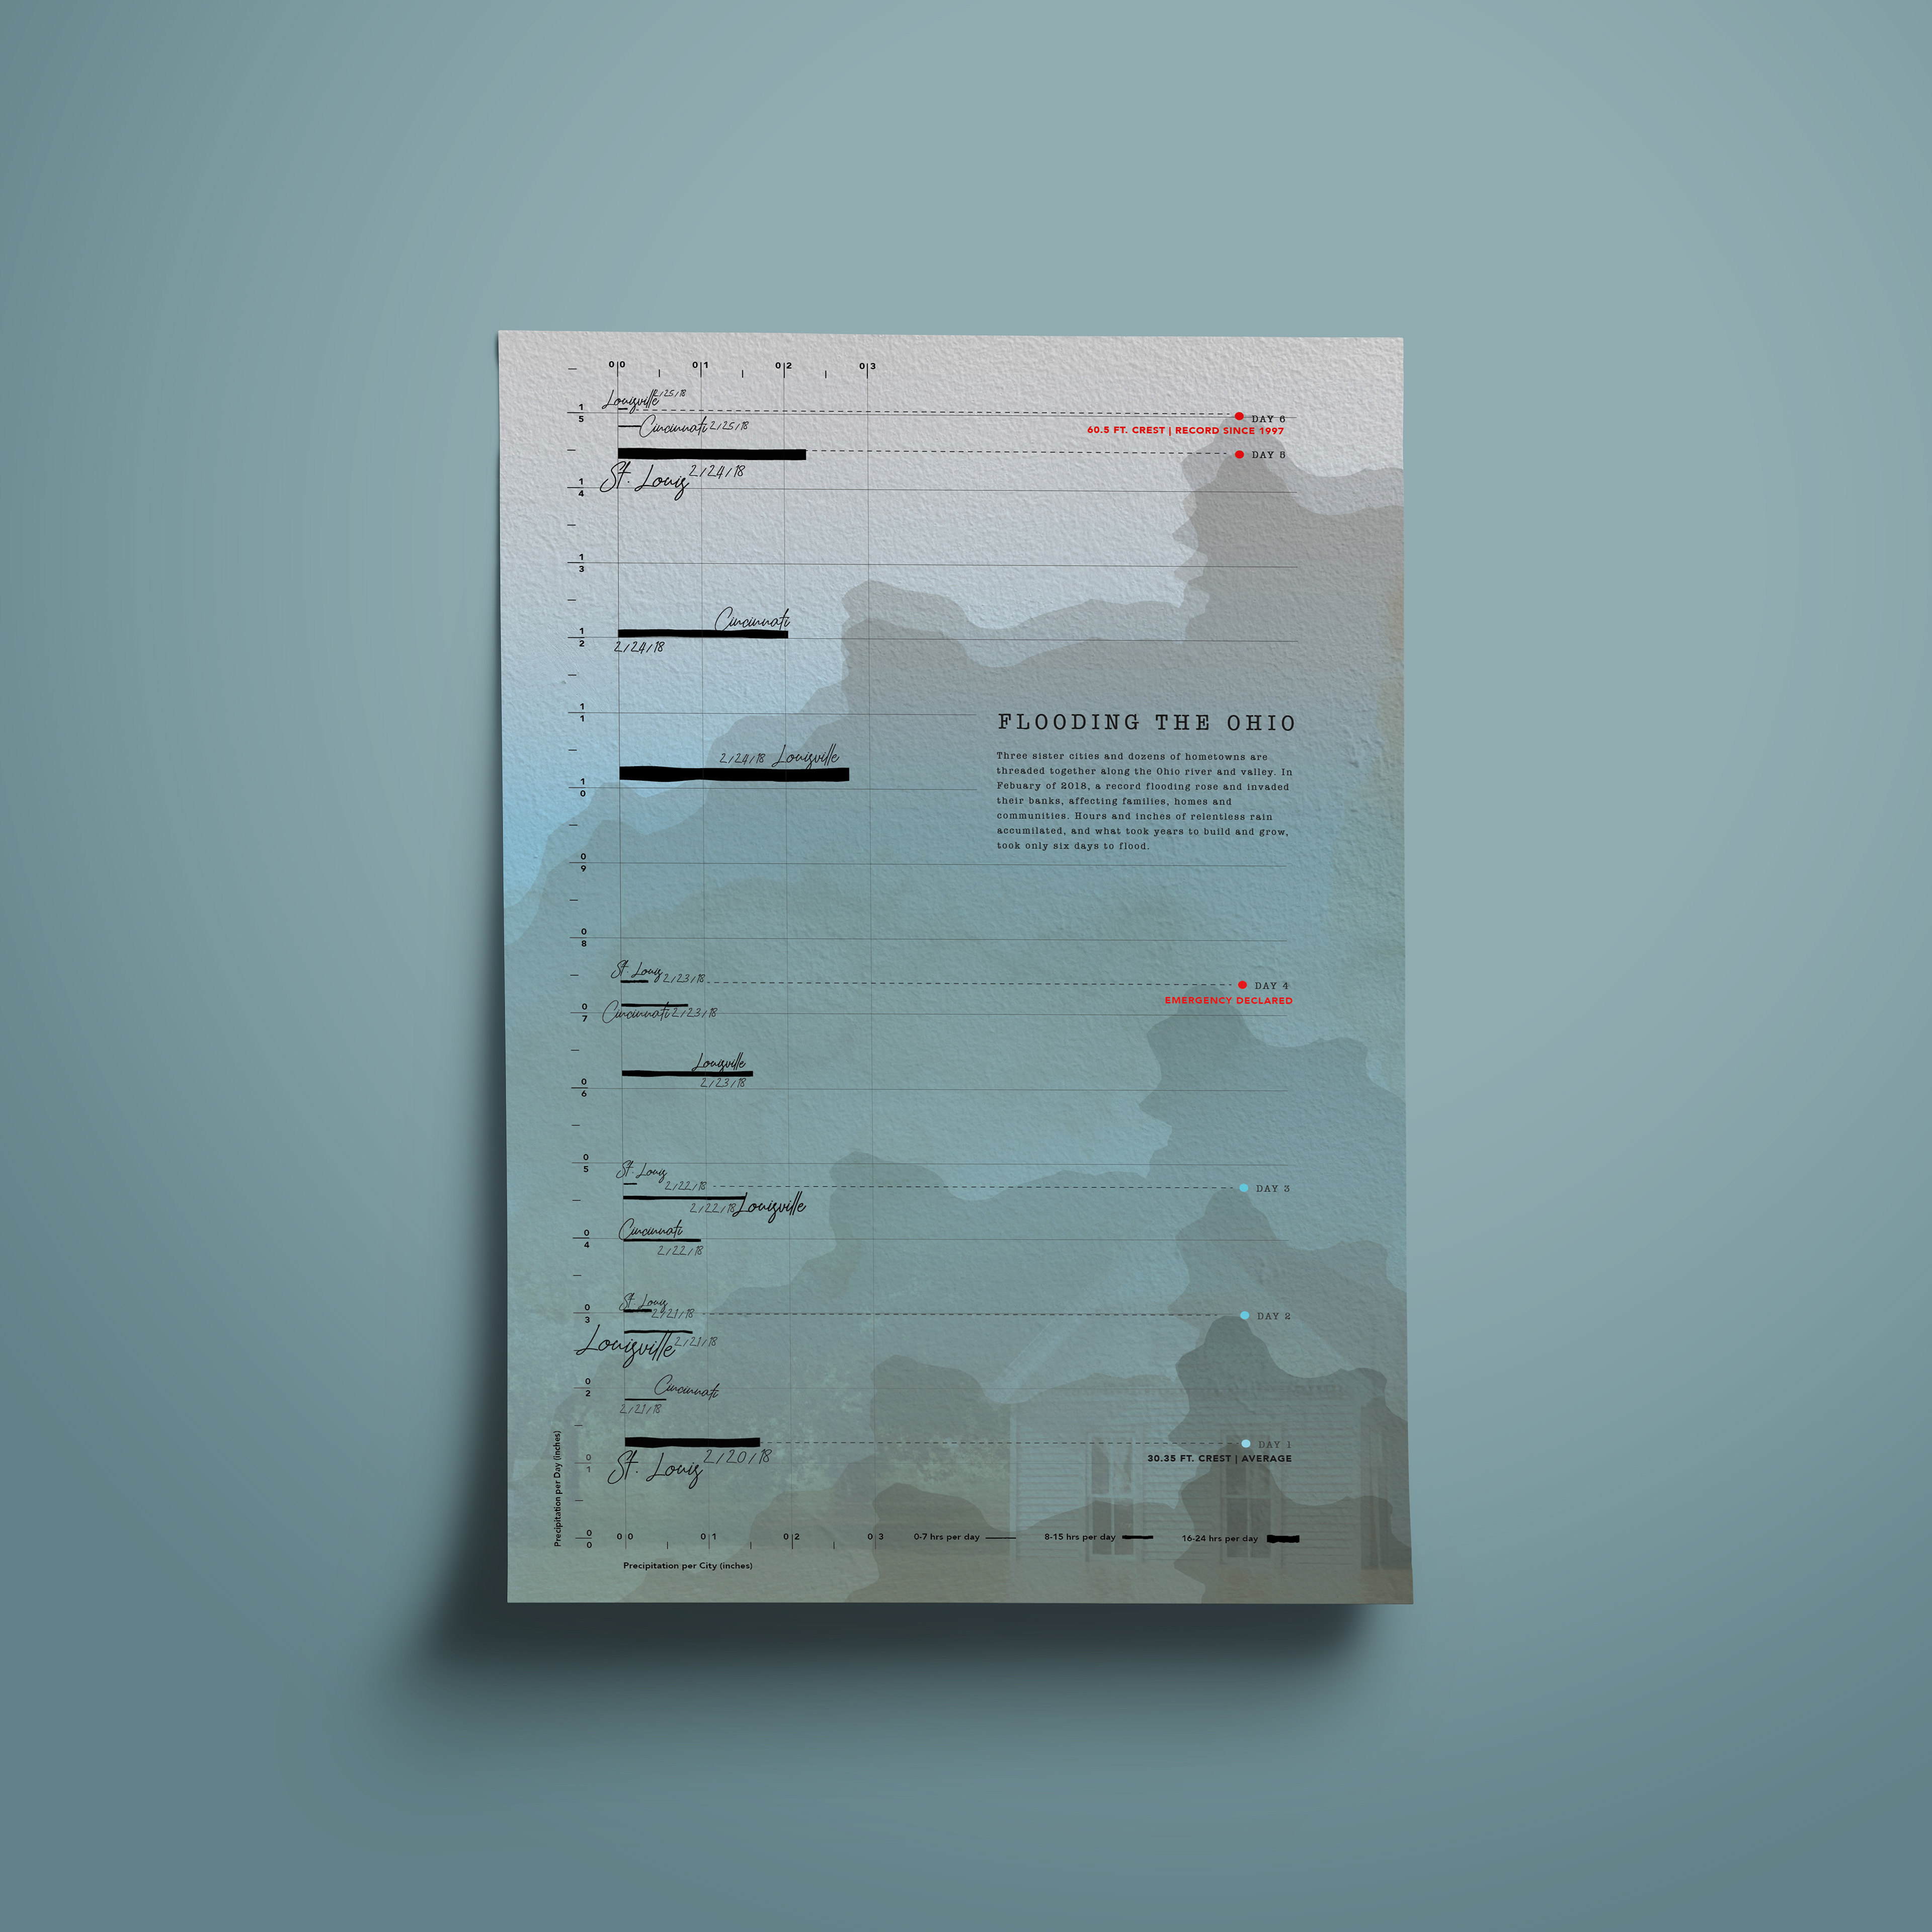
The aim of this piece is to represent those who call the Midwest home. This piece provides a way to give more empathy than what can be felt when just looking at weather apps or hearing it on the news.
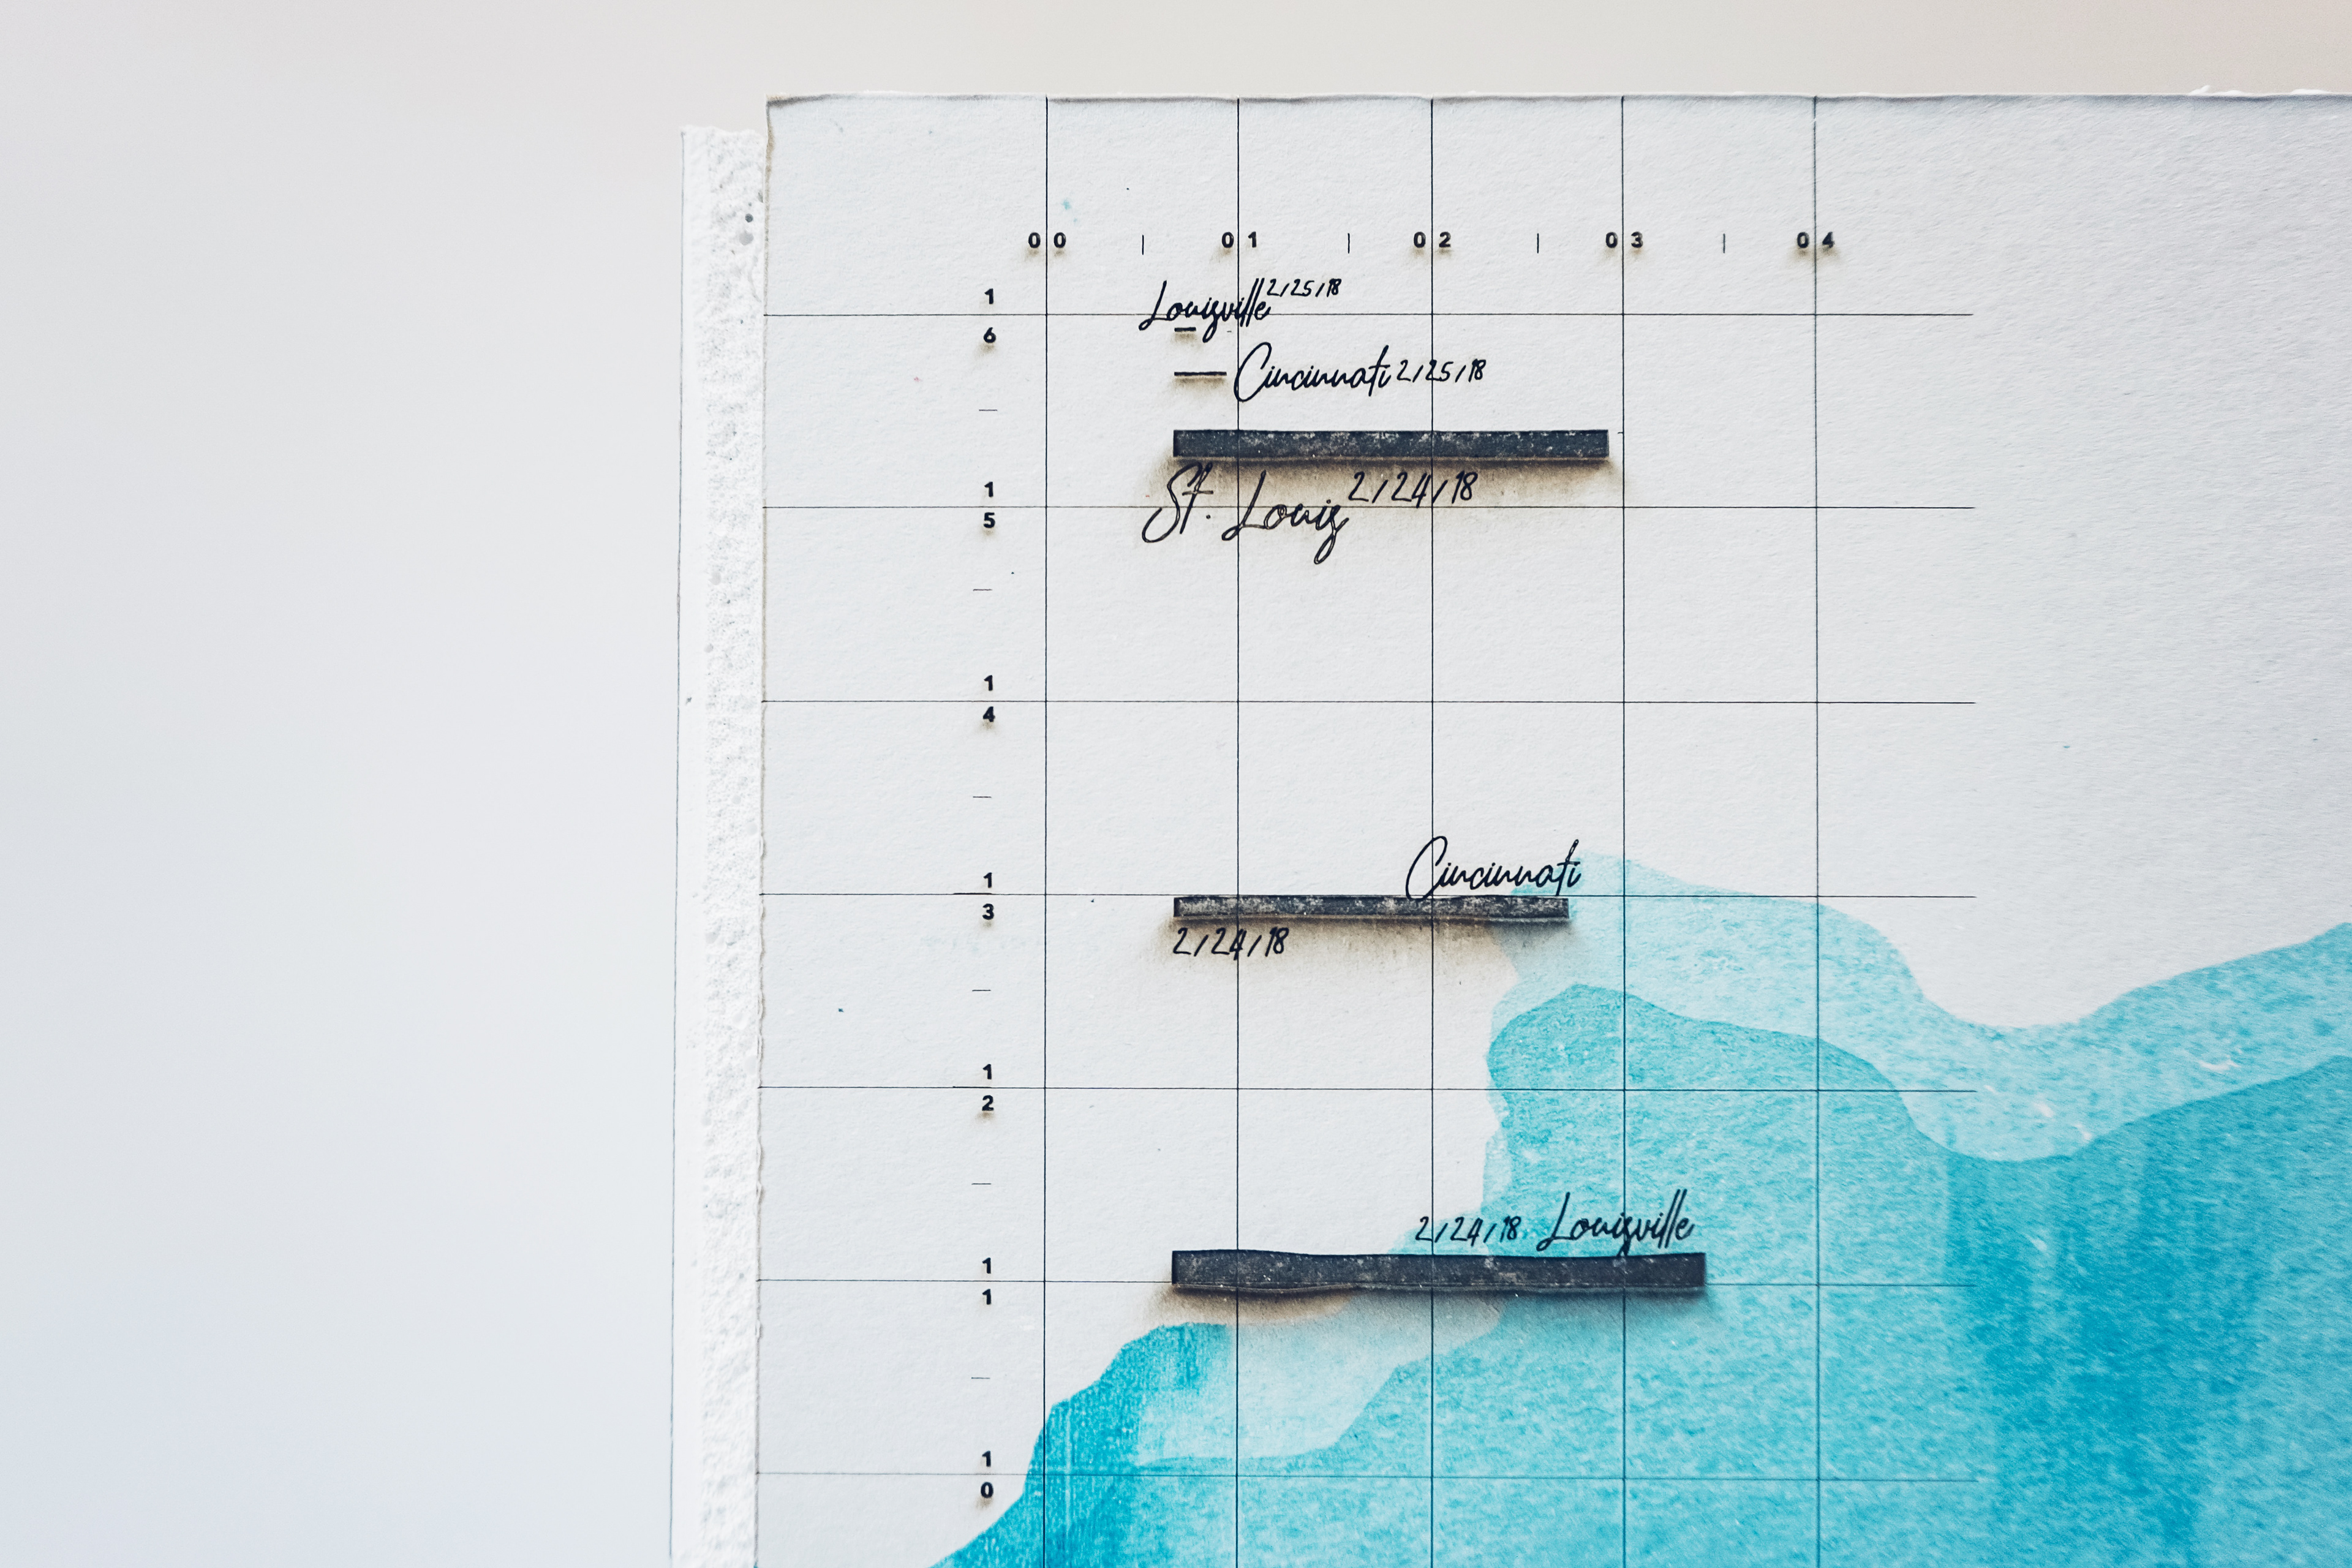
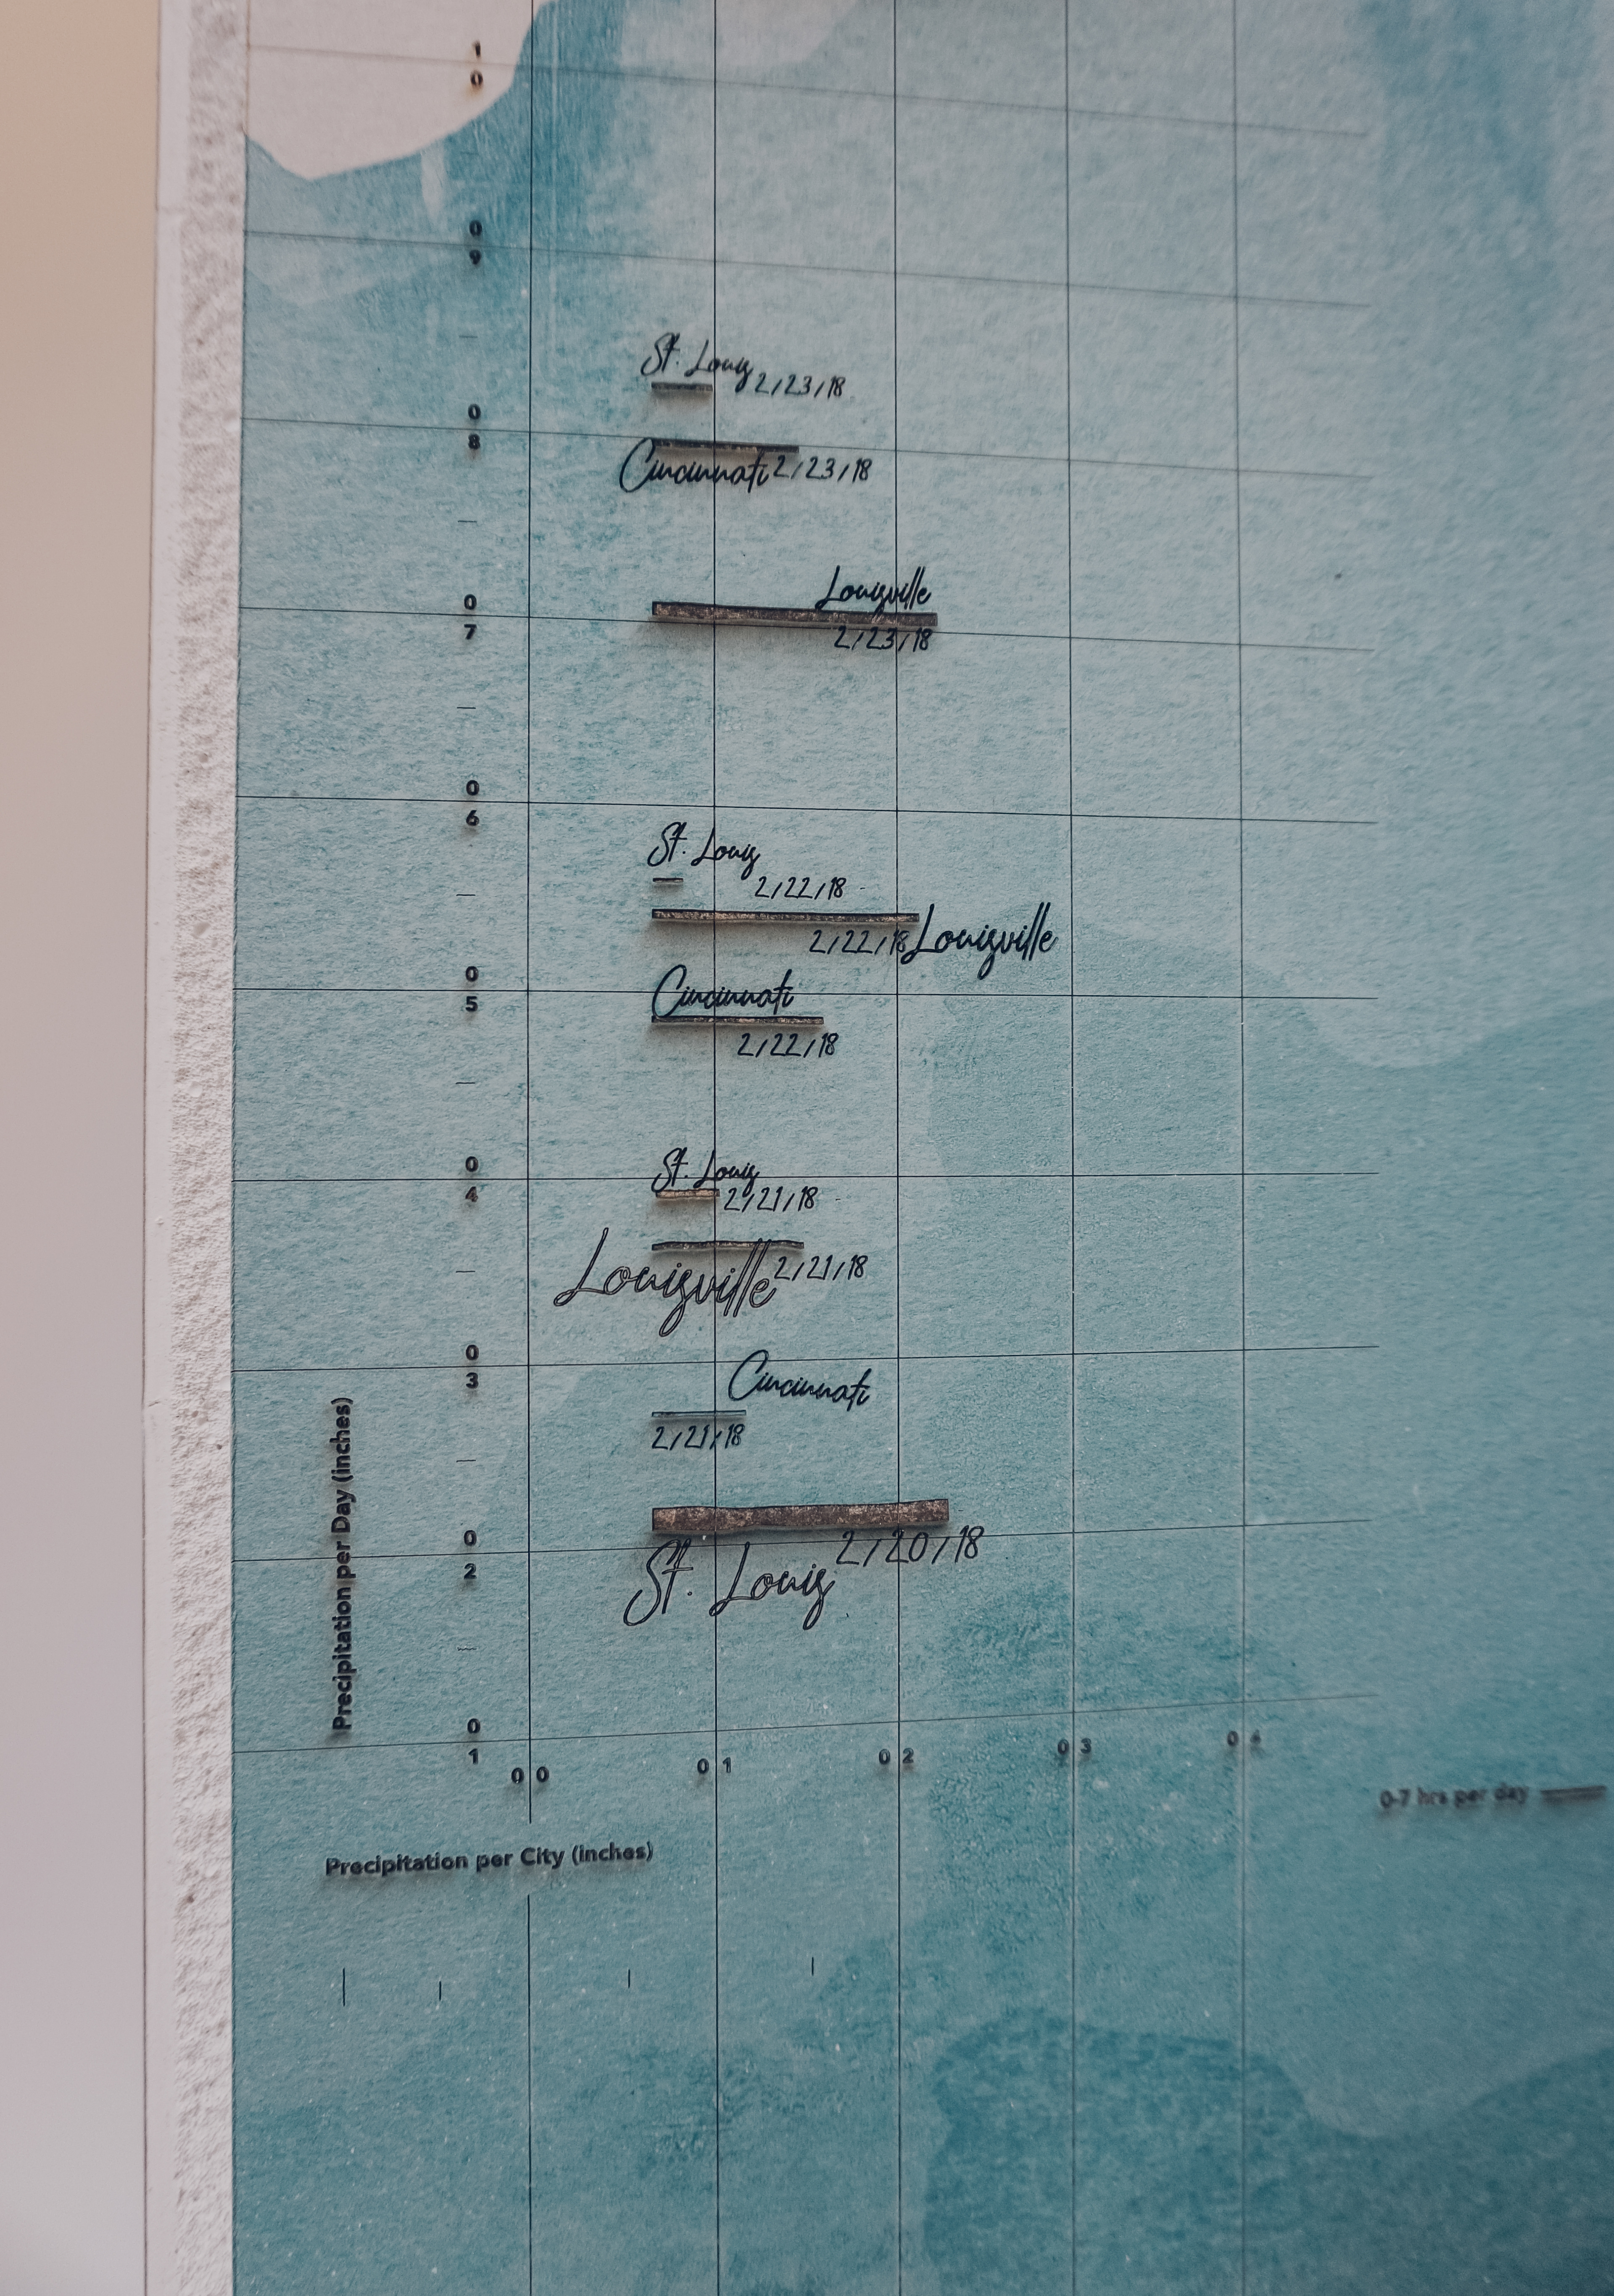
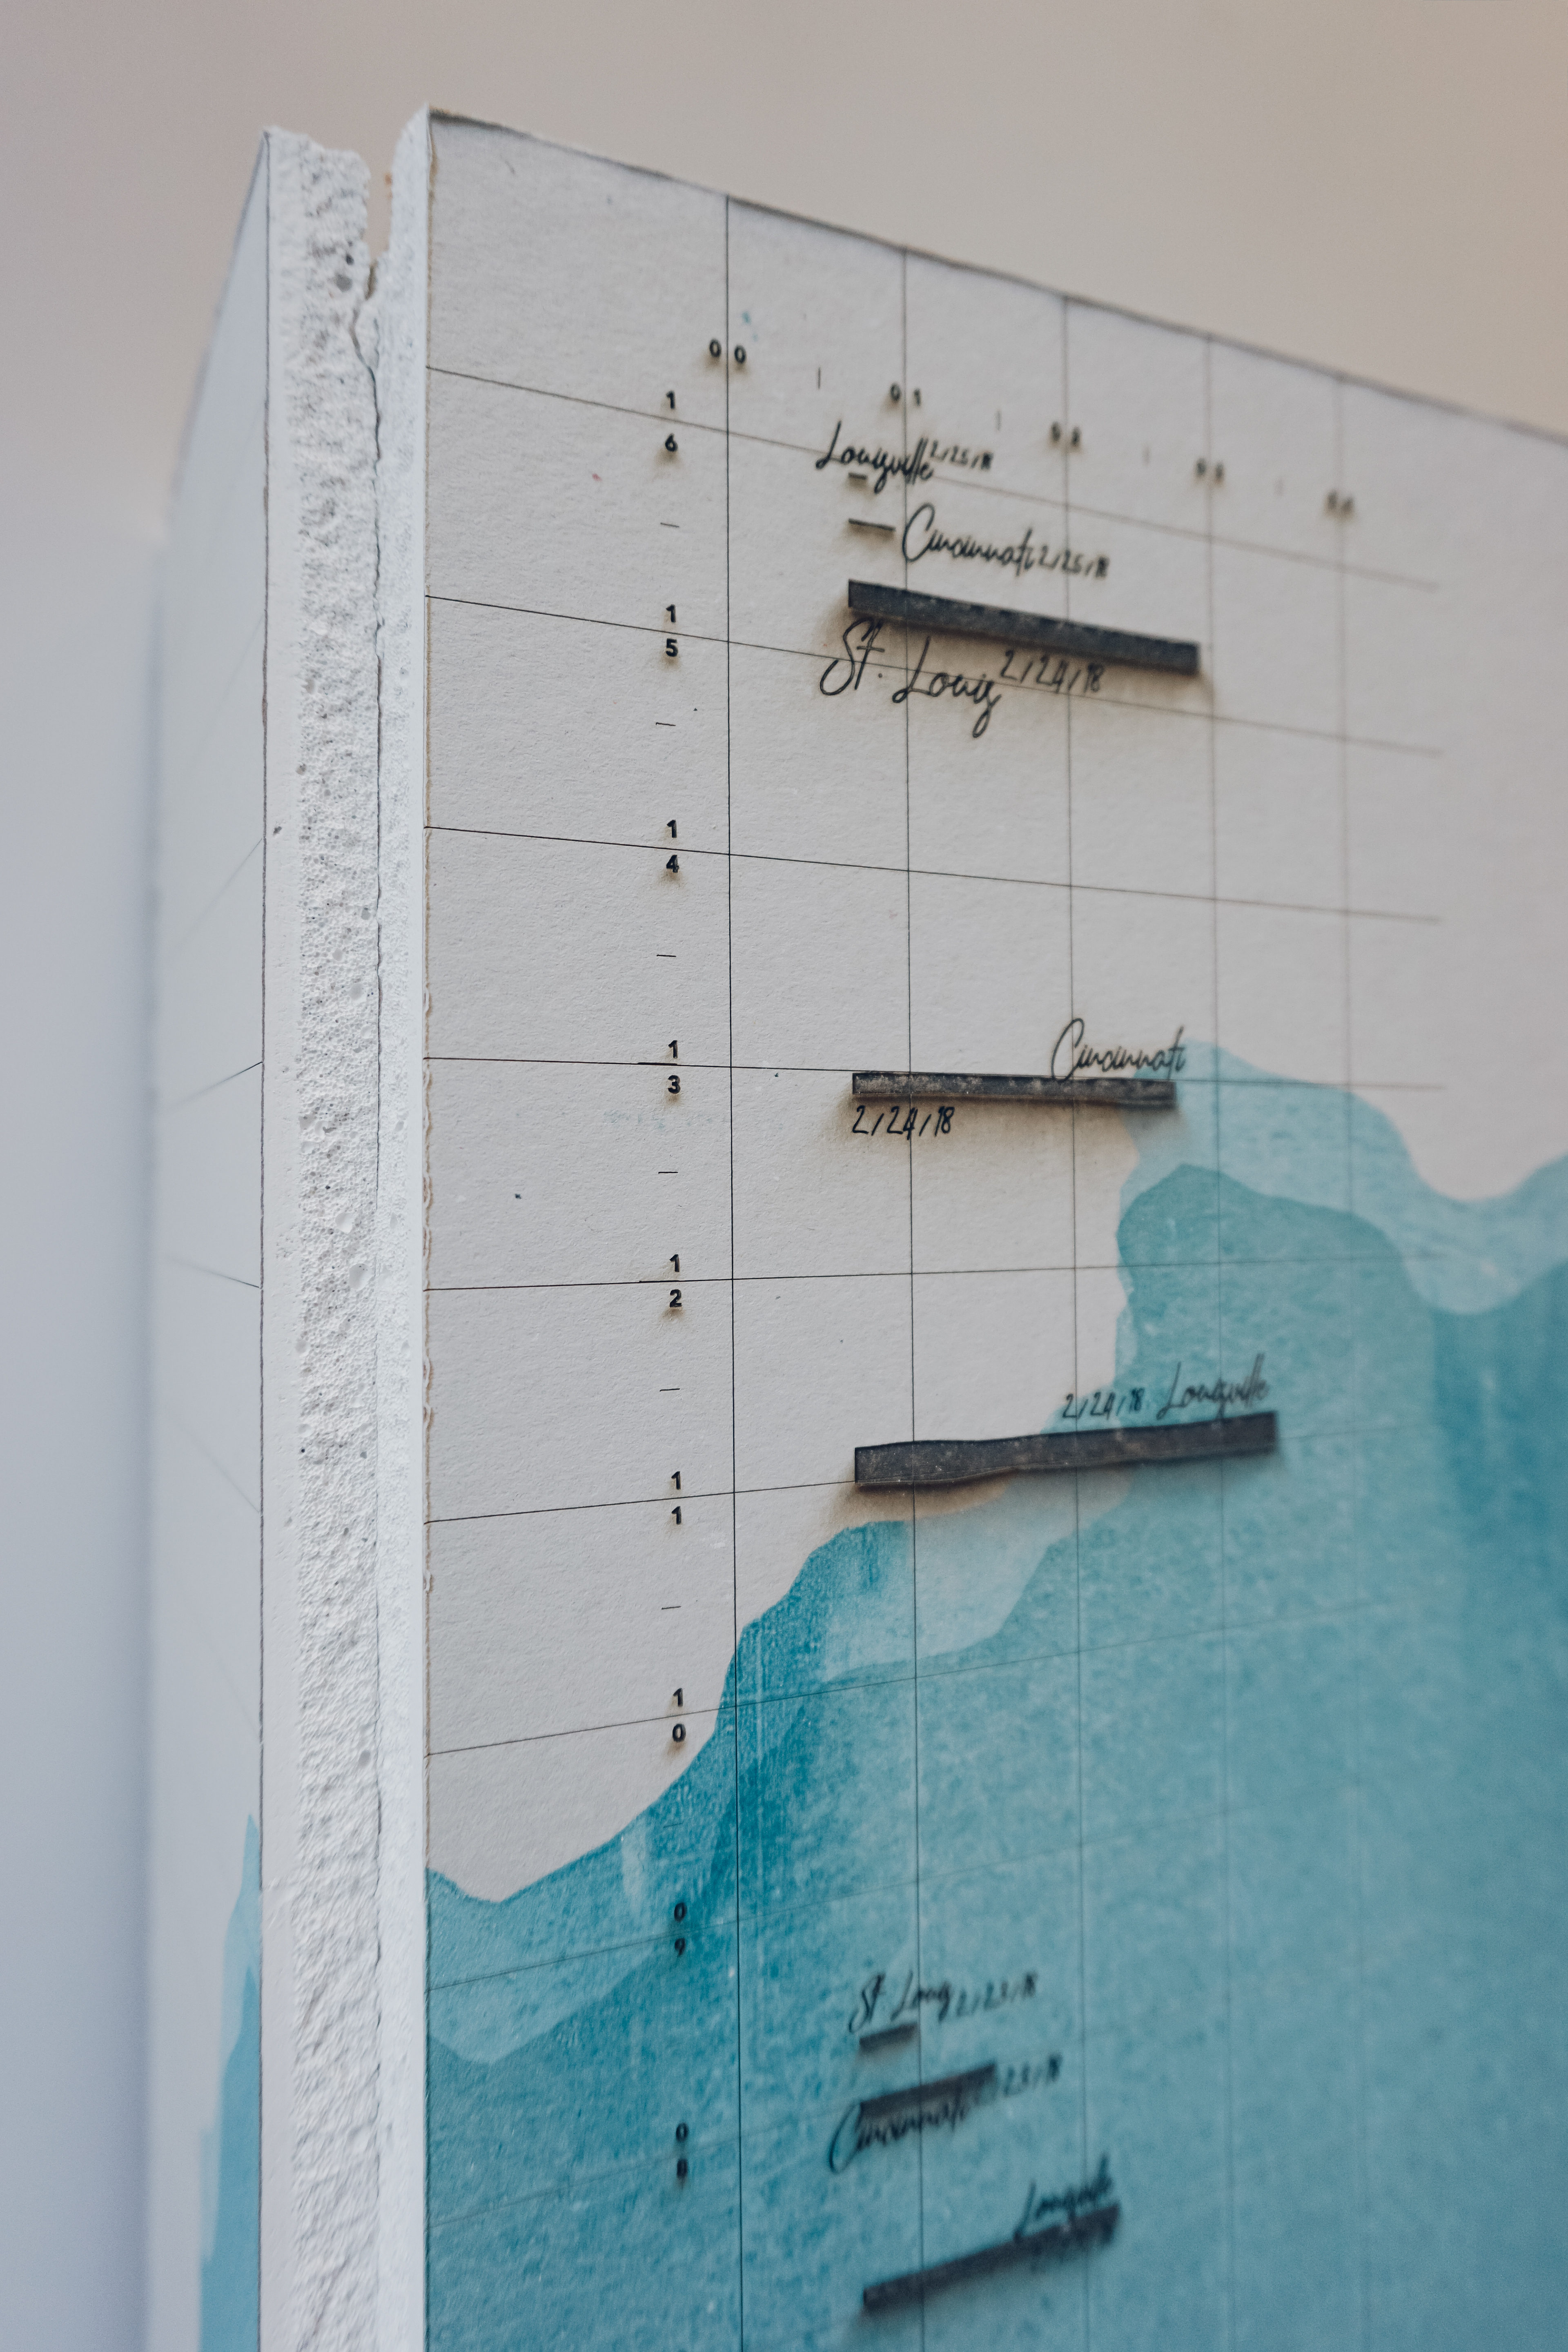
The water and data grows up the piece of drywall just as our recorded heights did as we grew up.
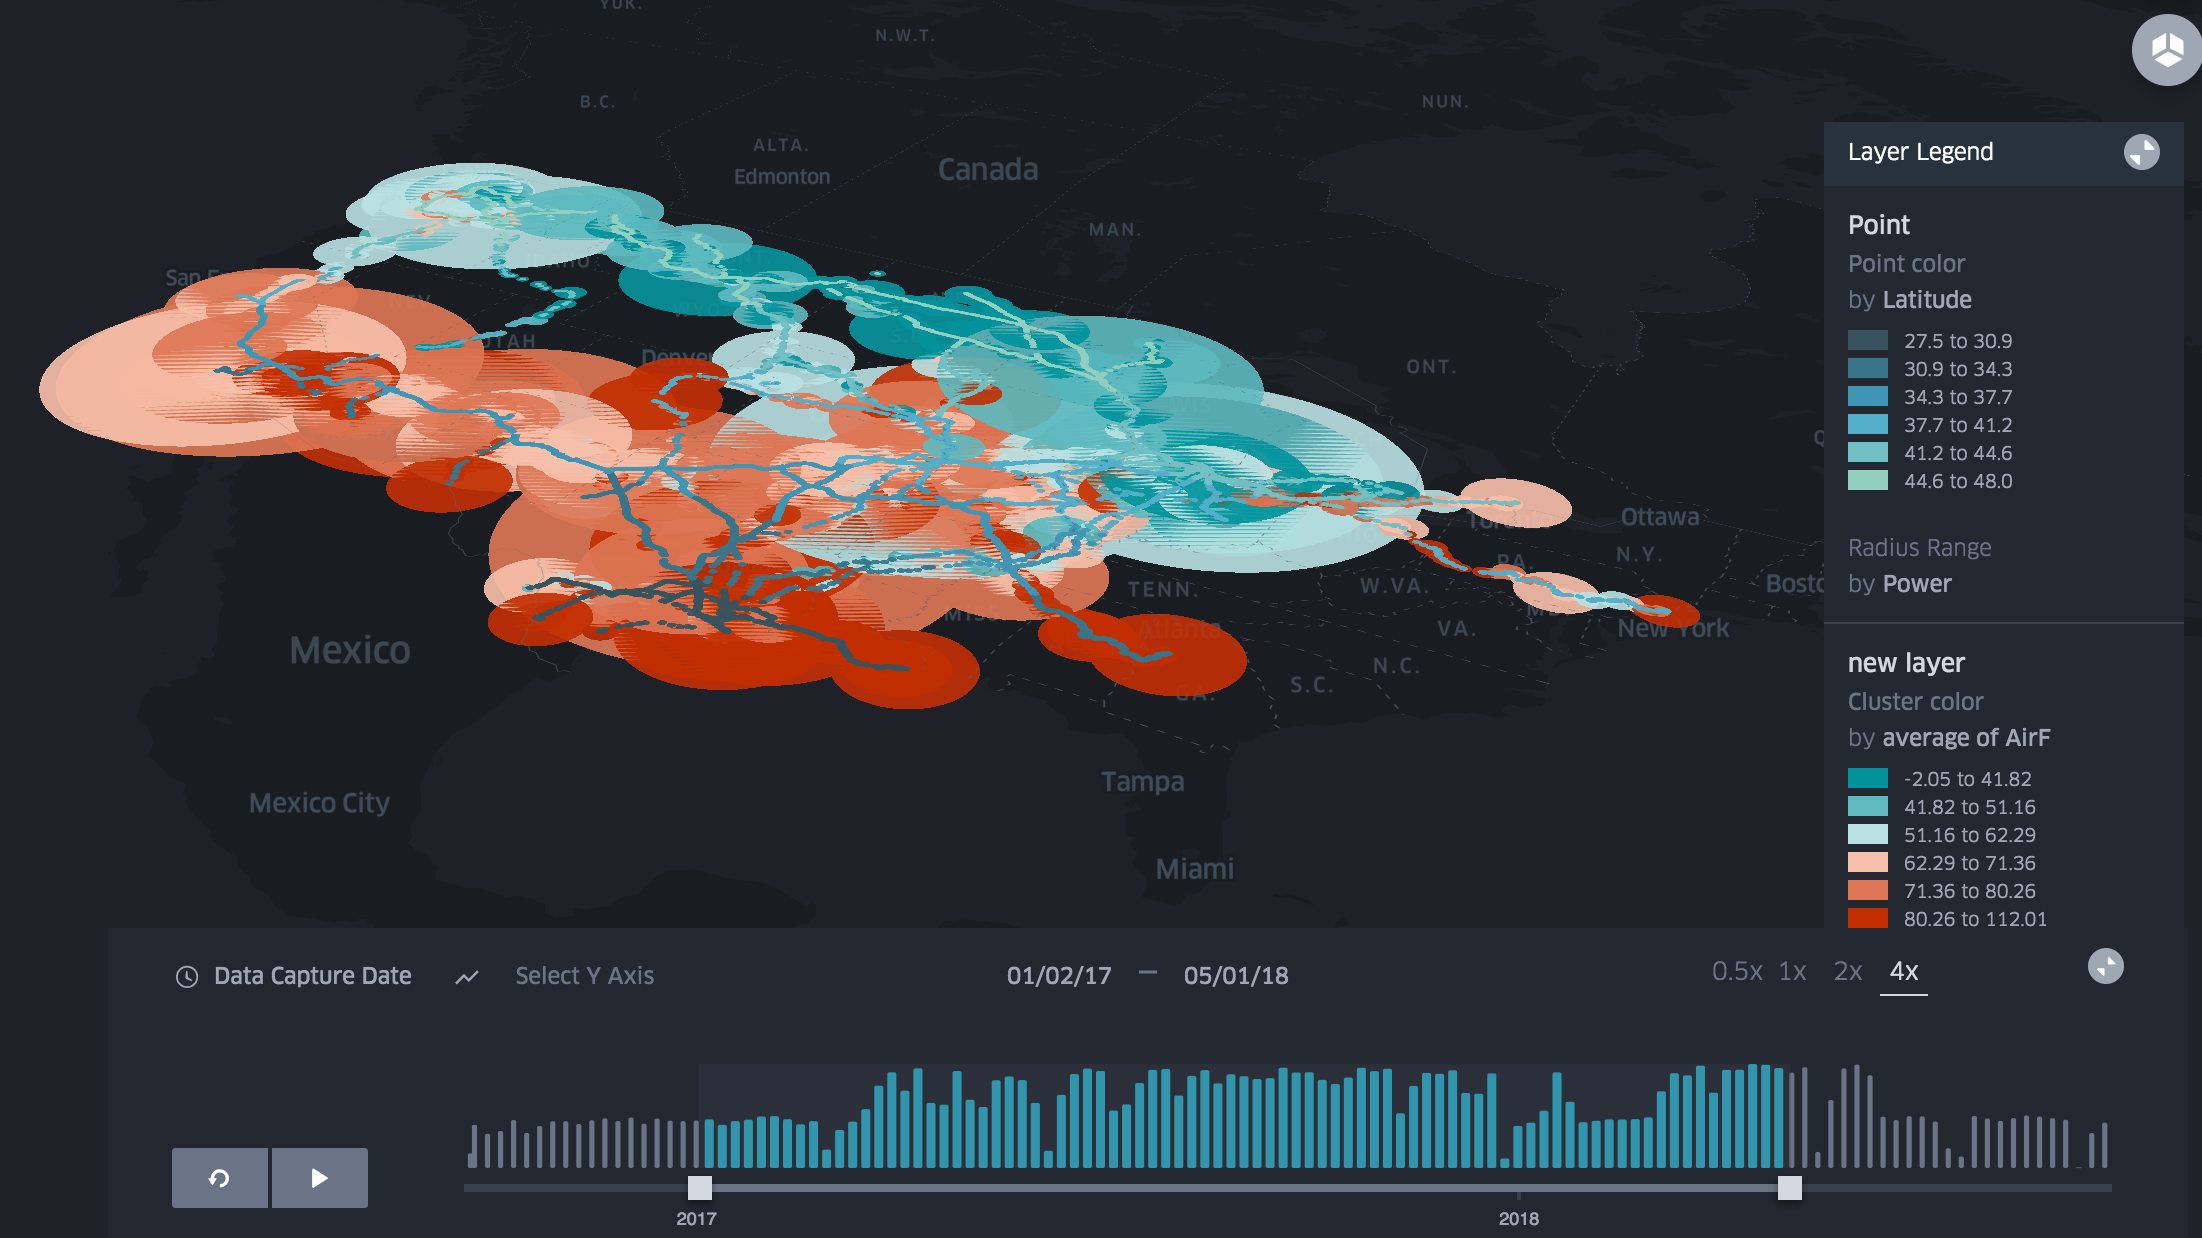
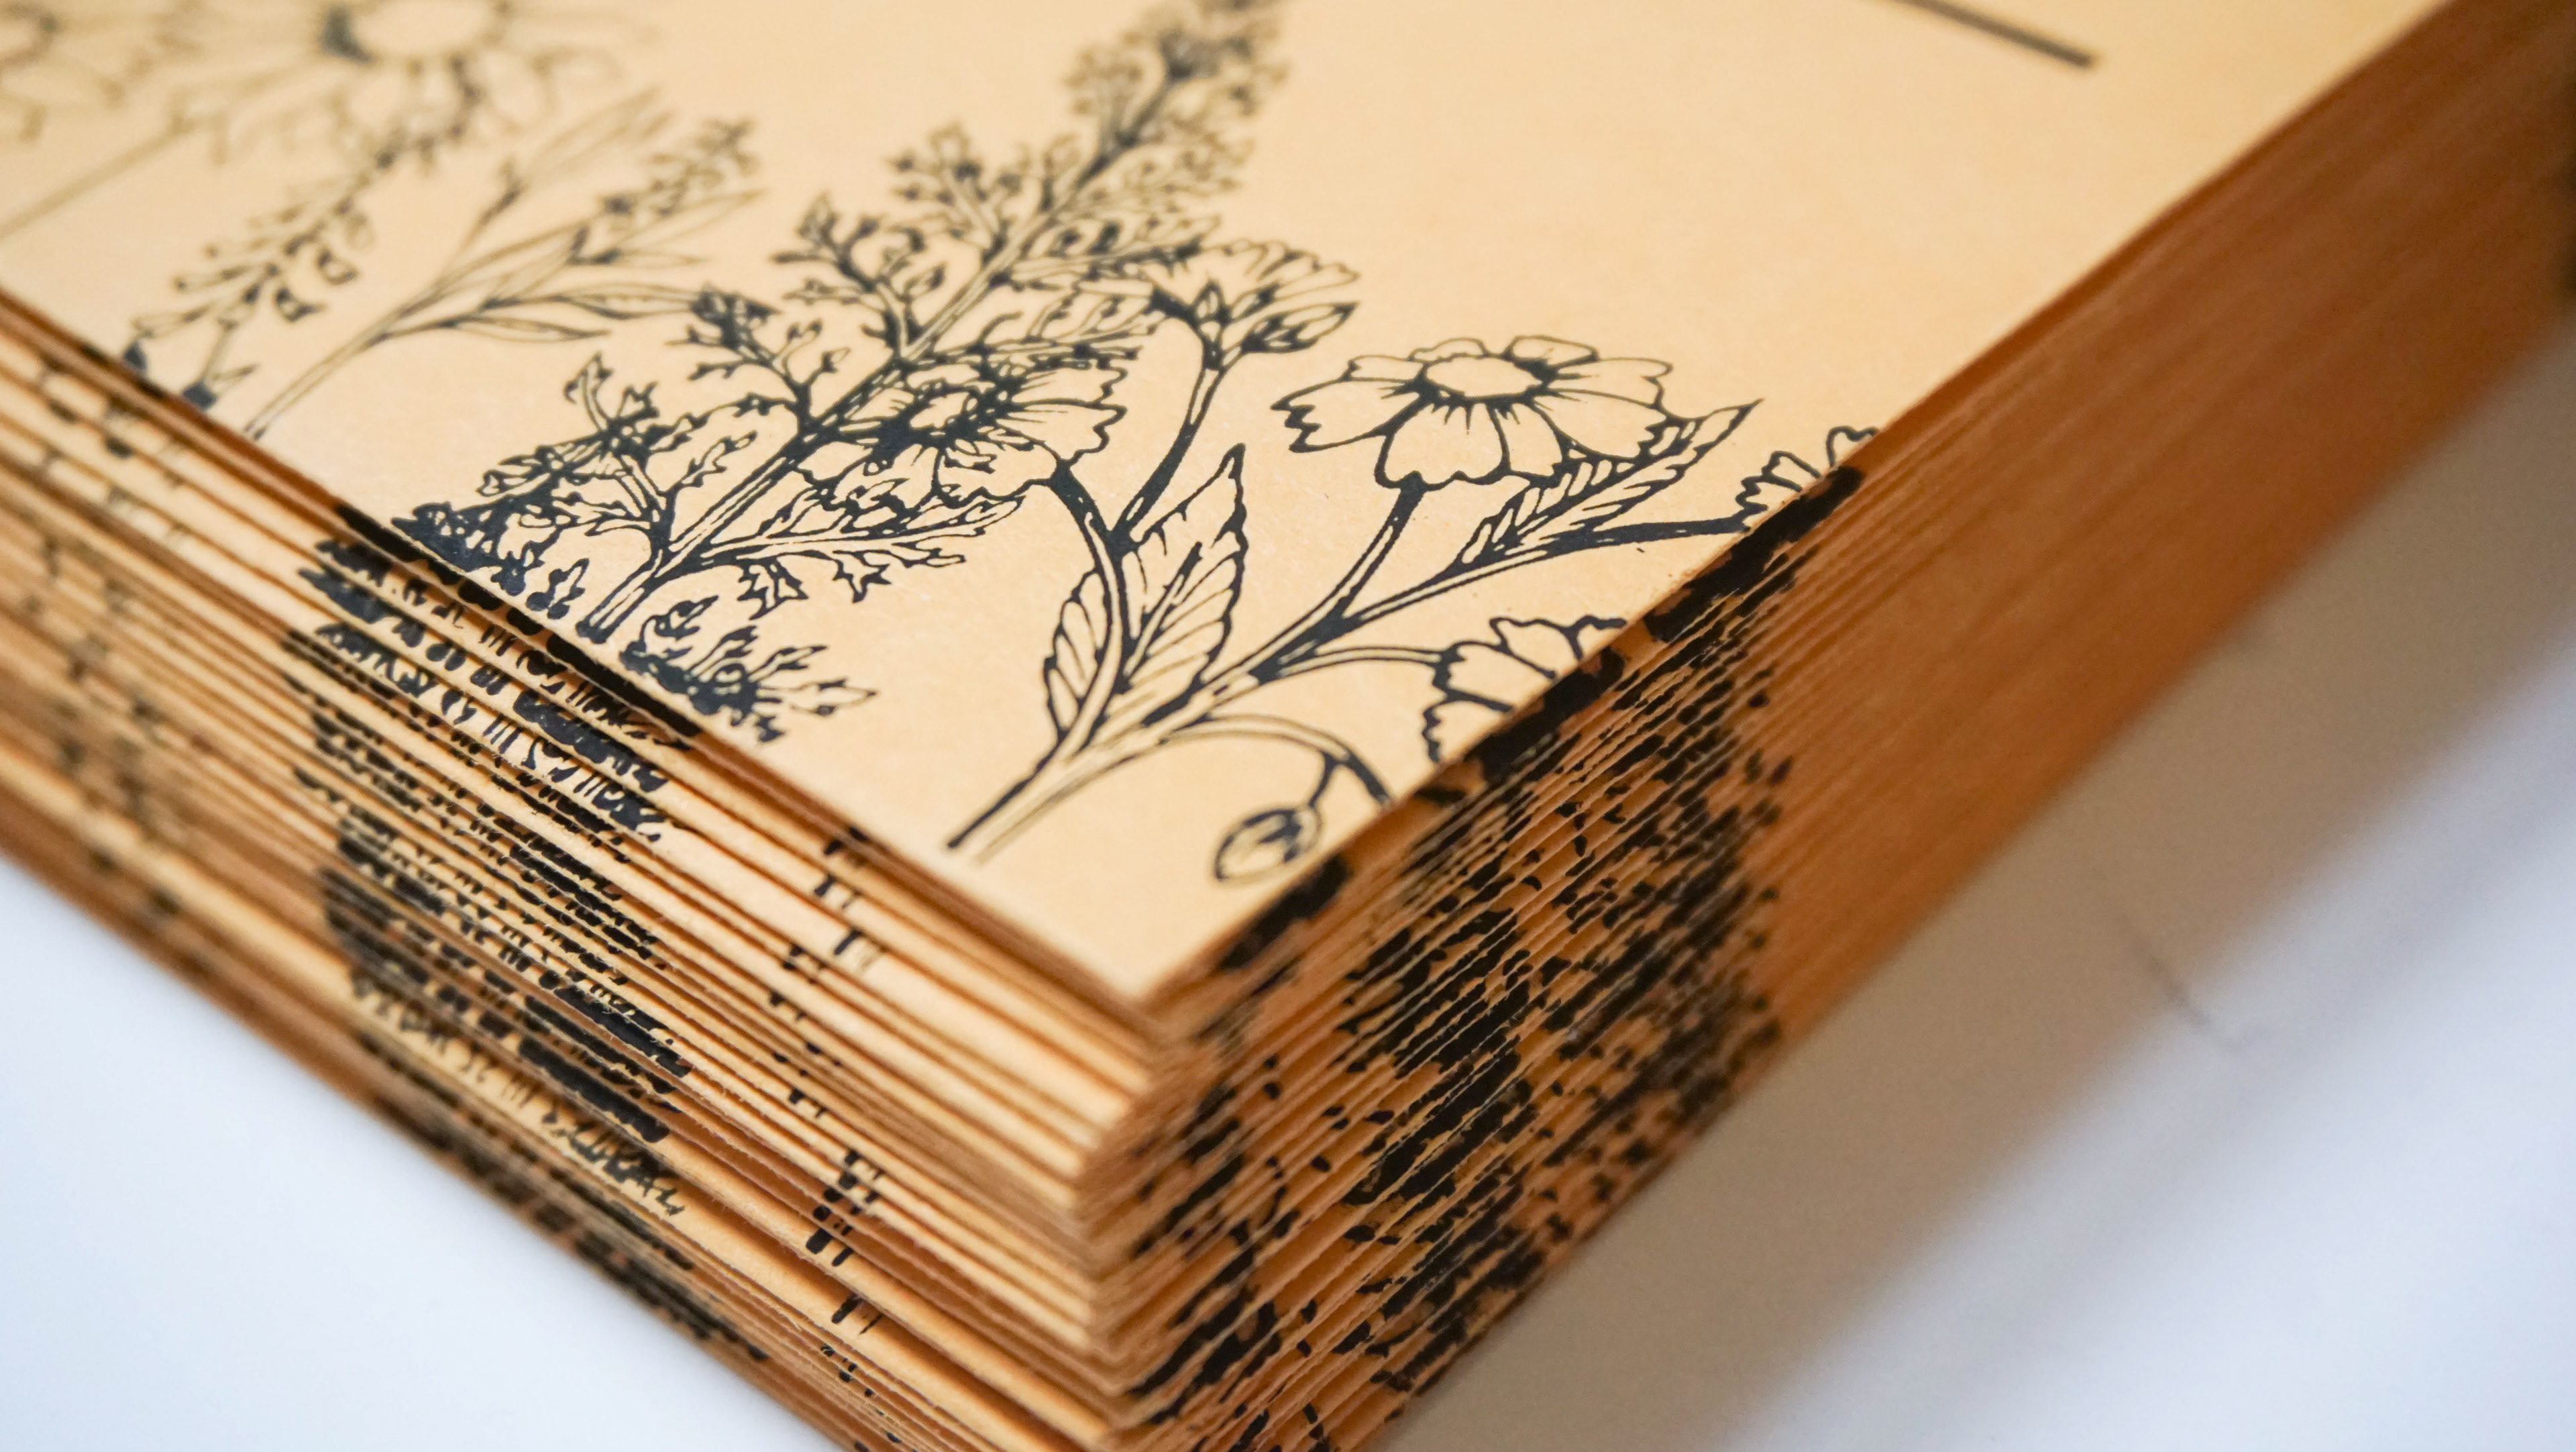
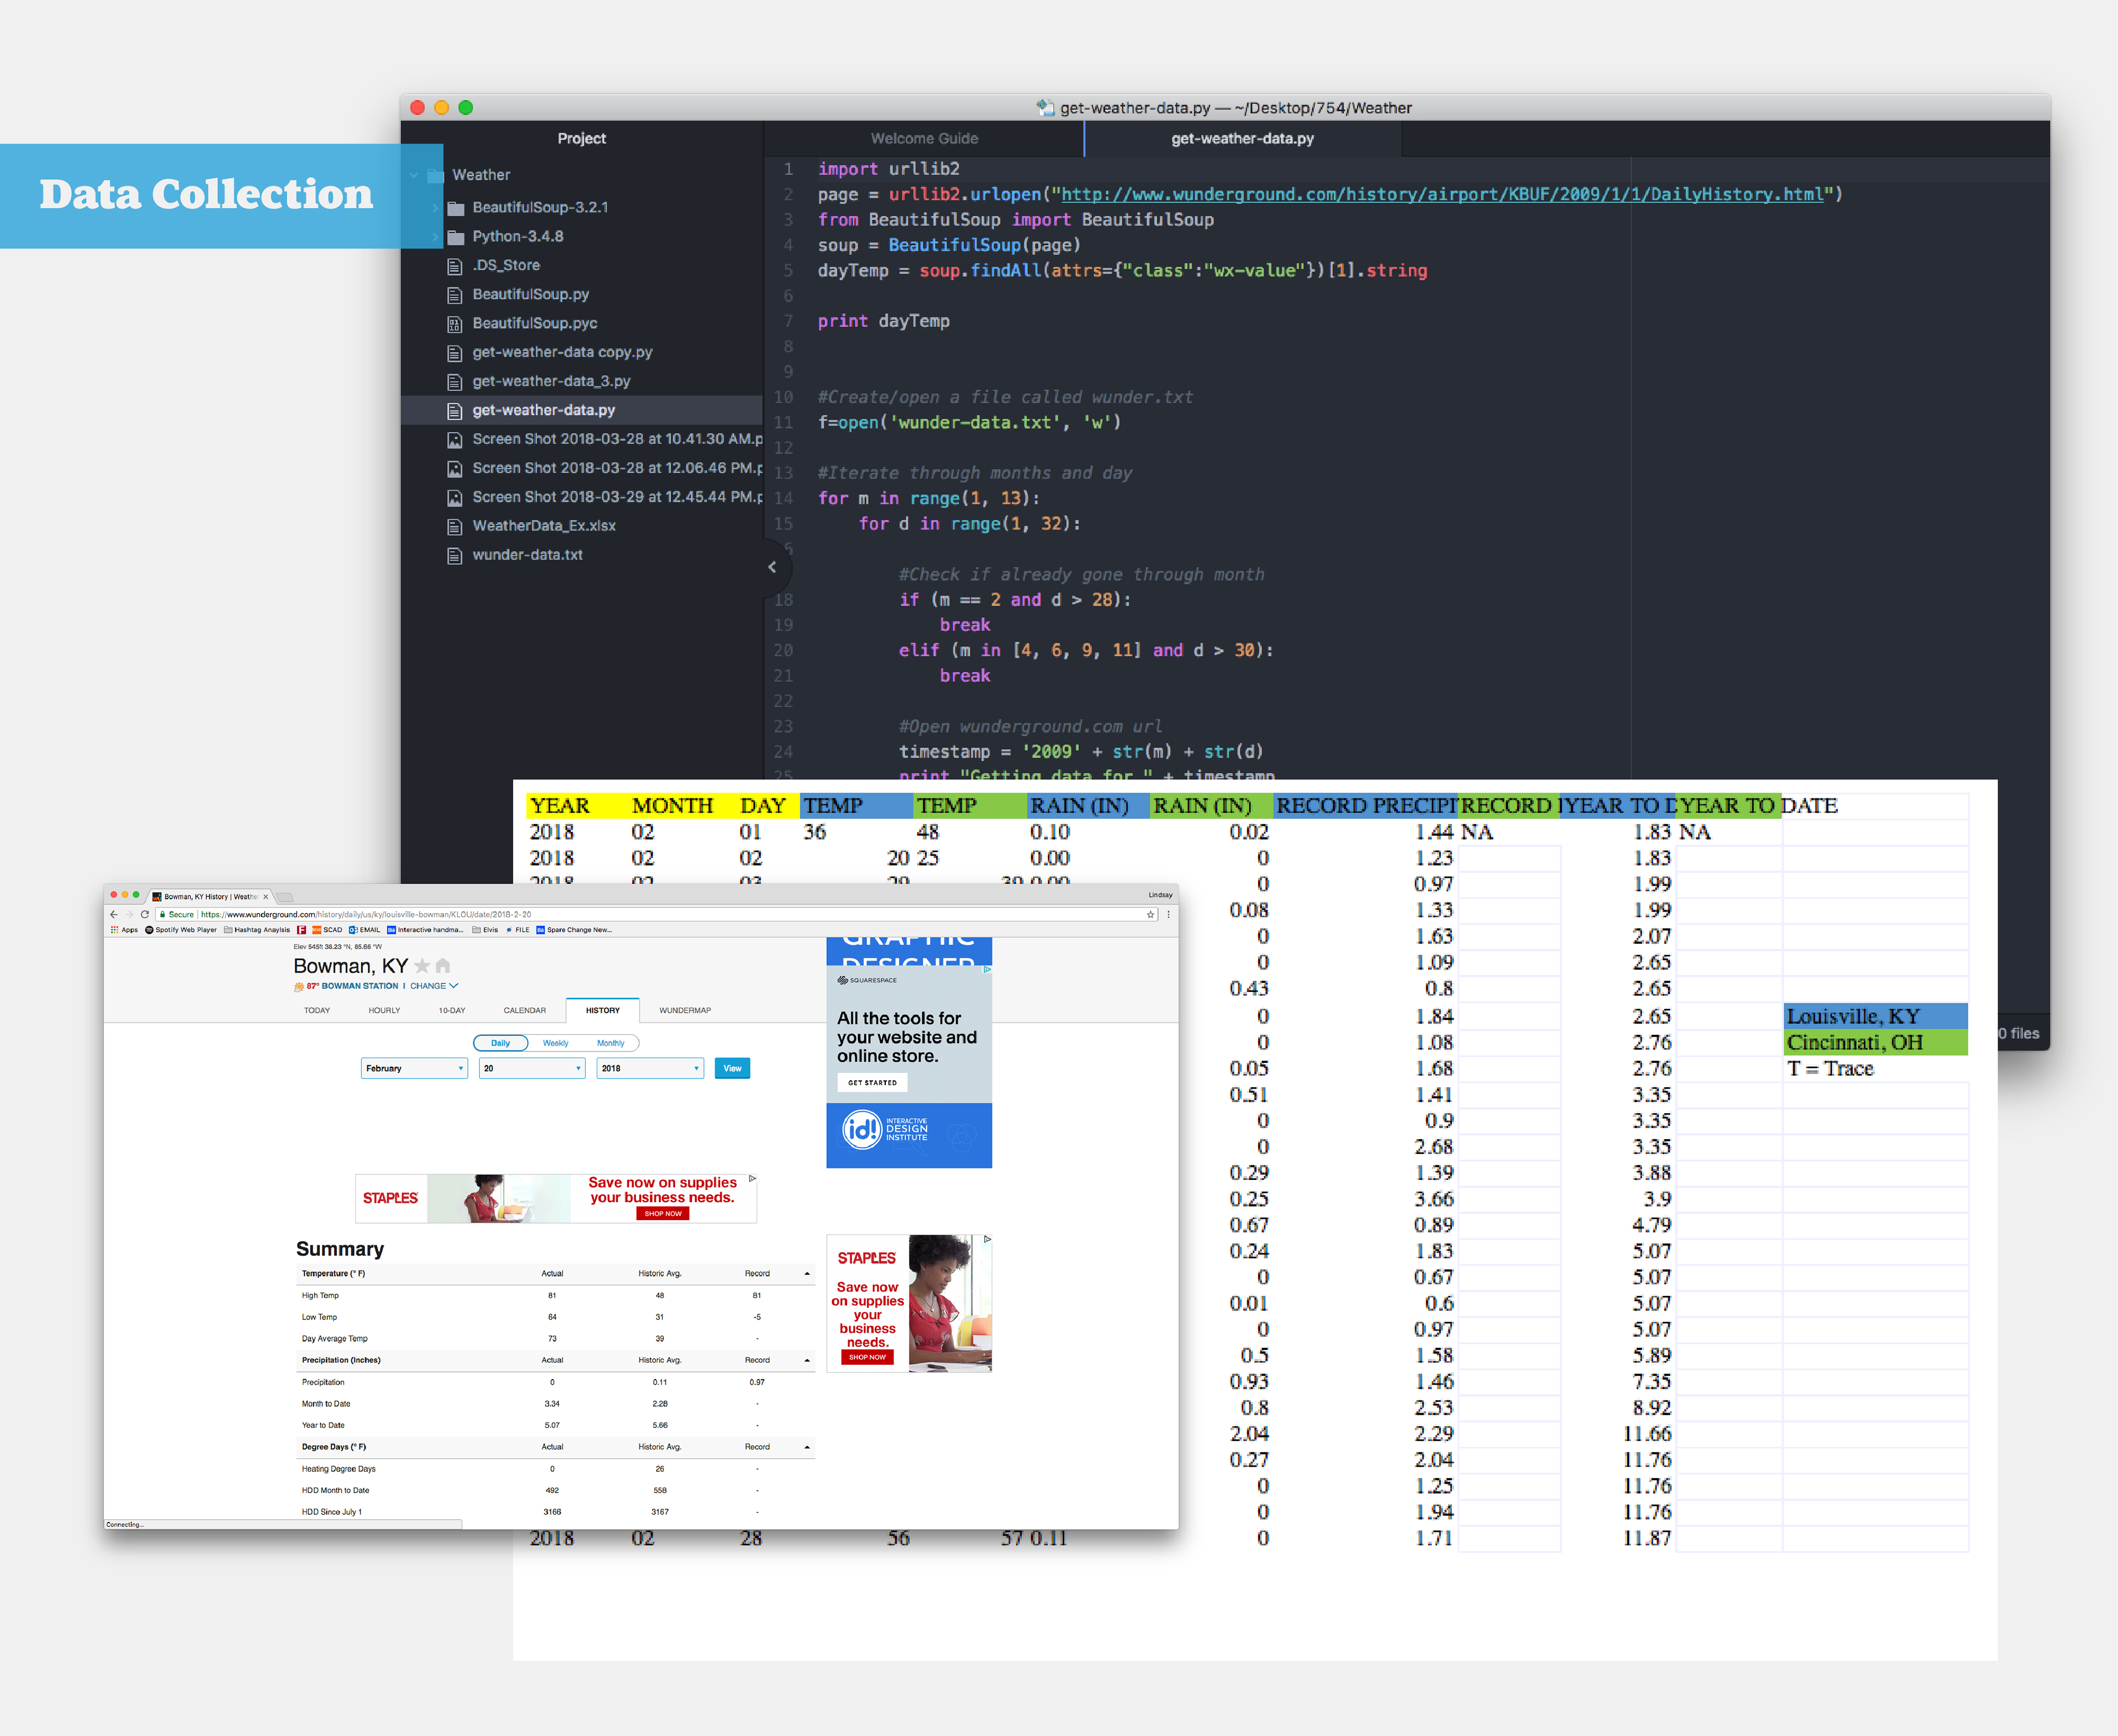
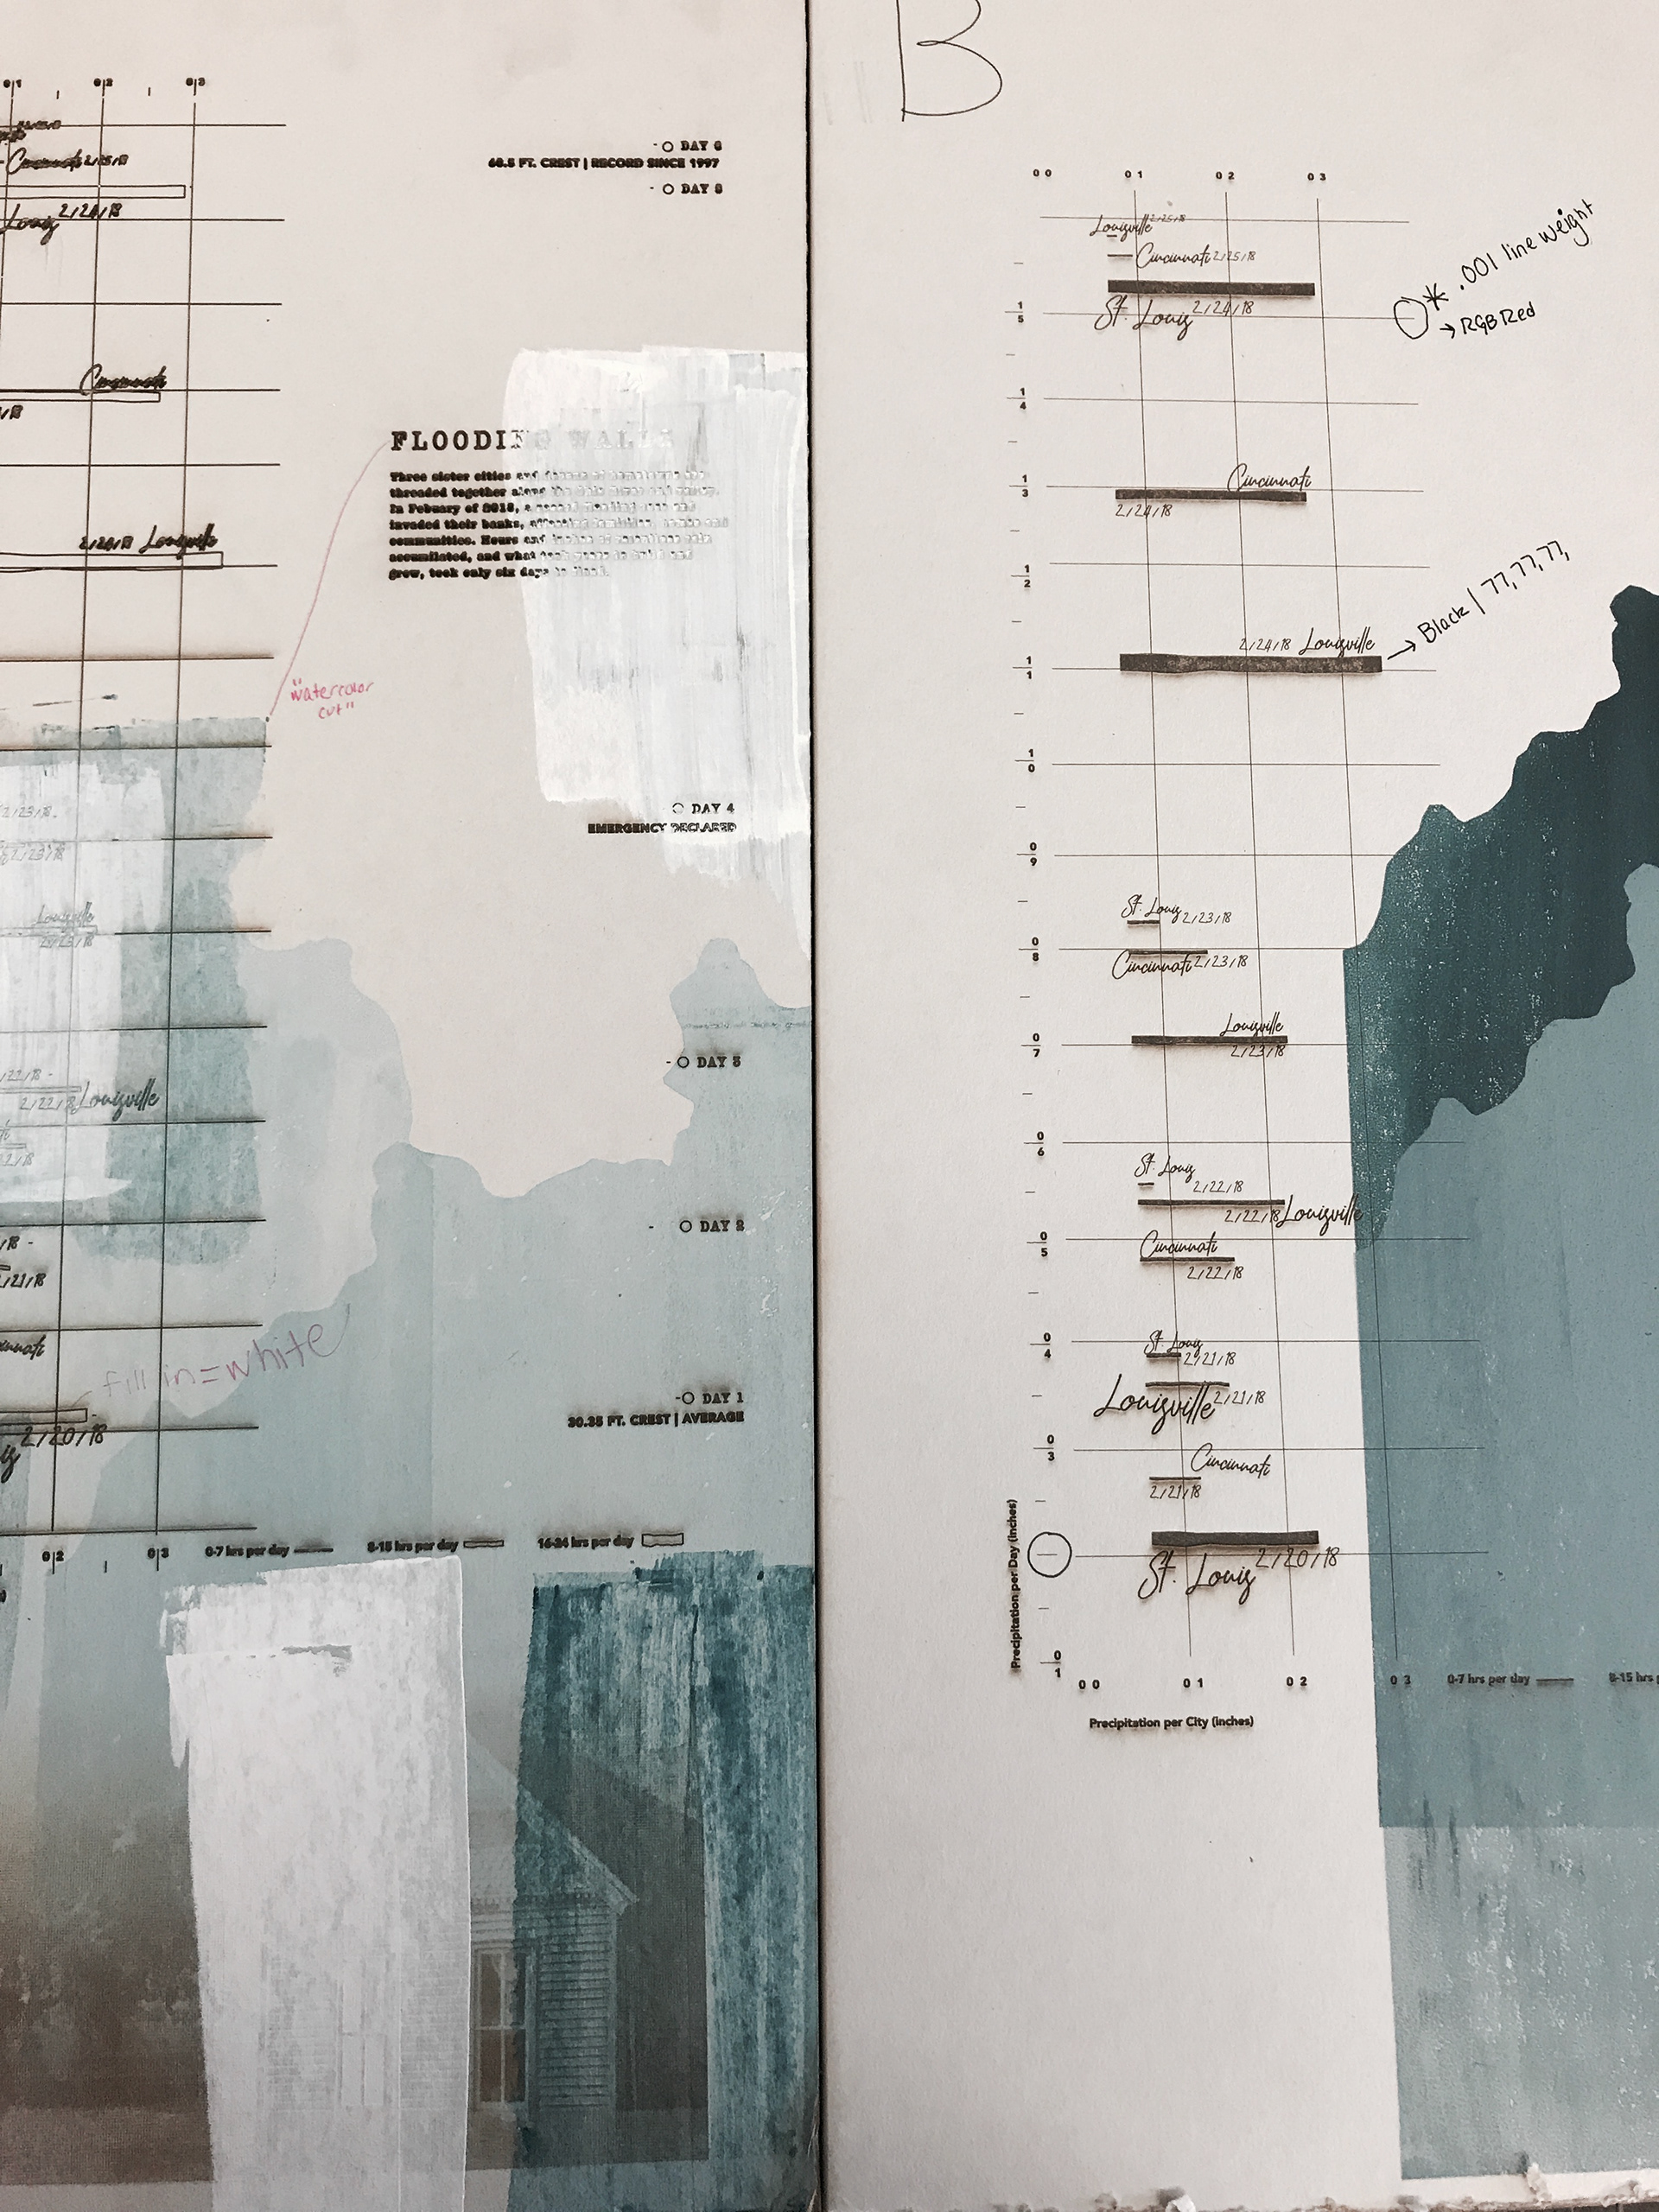
The data was collected by scraping weather sites that triangulated the area of interest. Then, focusing on ethical data collect practices, I experimented with ways to visualize the patterns and grown represented in the data.
The data was represented digitally, but I felt the flat visual was not providing enough empathy or experience as the data deserved. Therefore, I began experimenting with materiality, engraving, printmaking and depth.
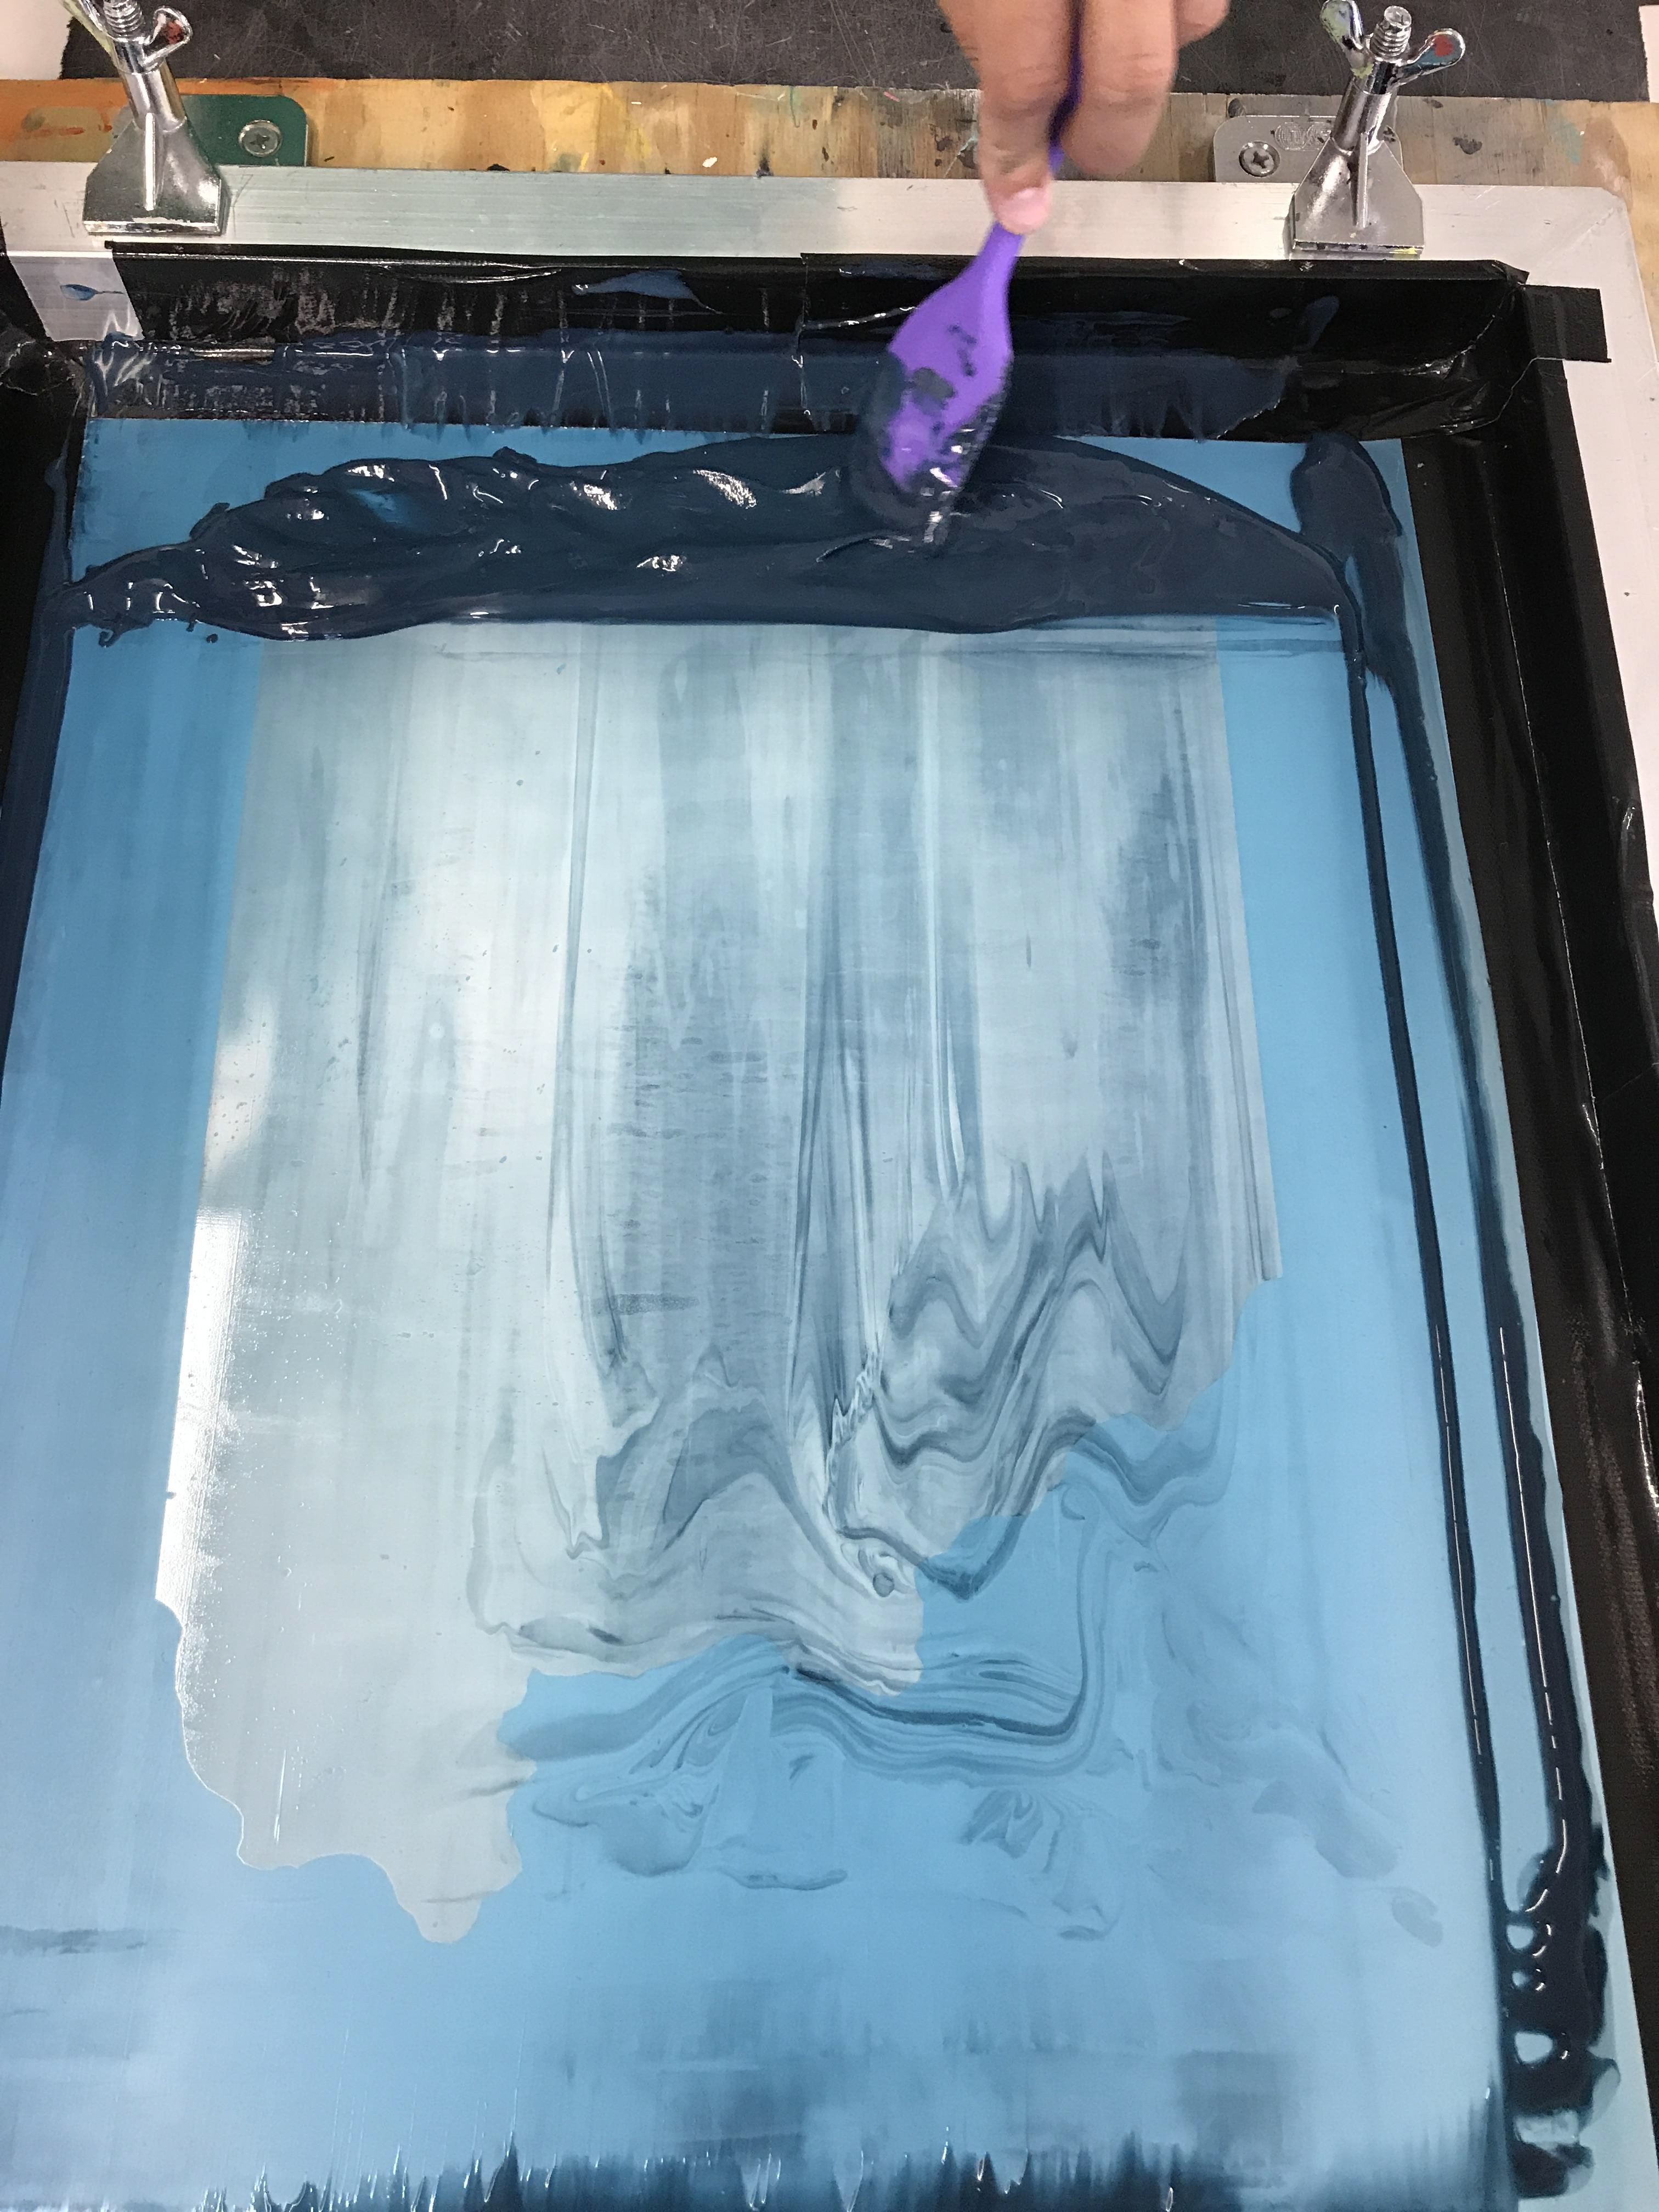
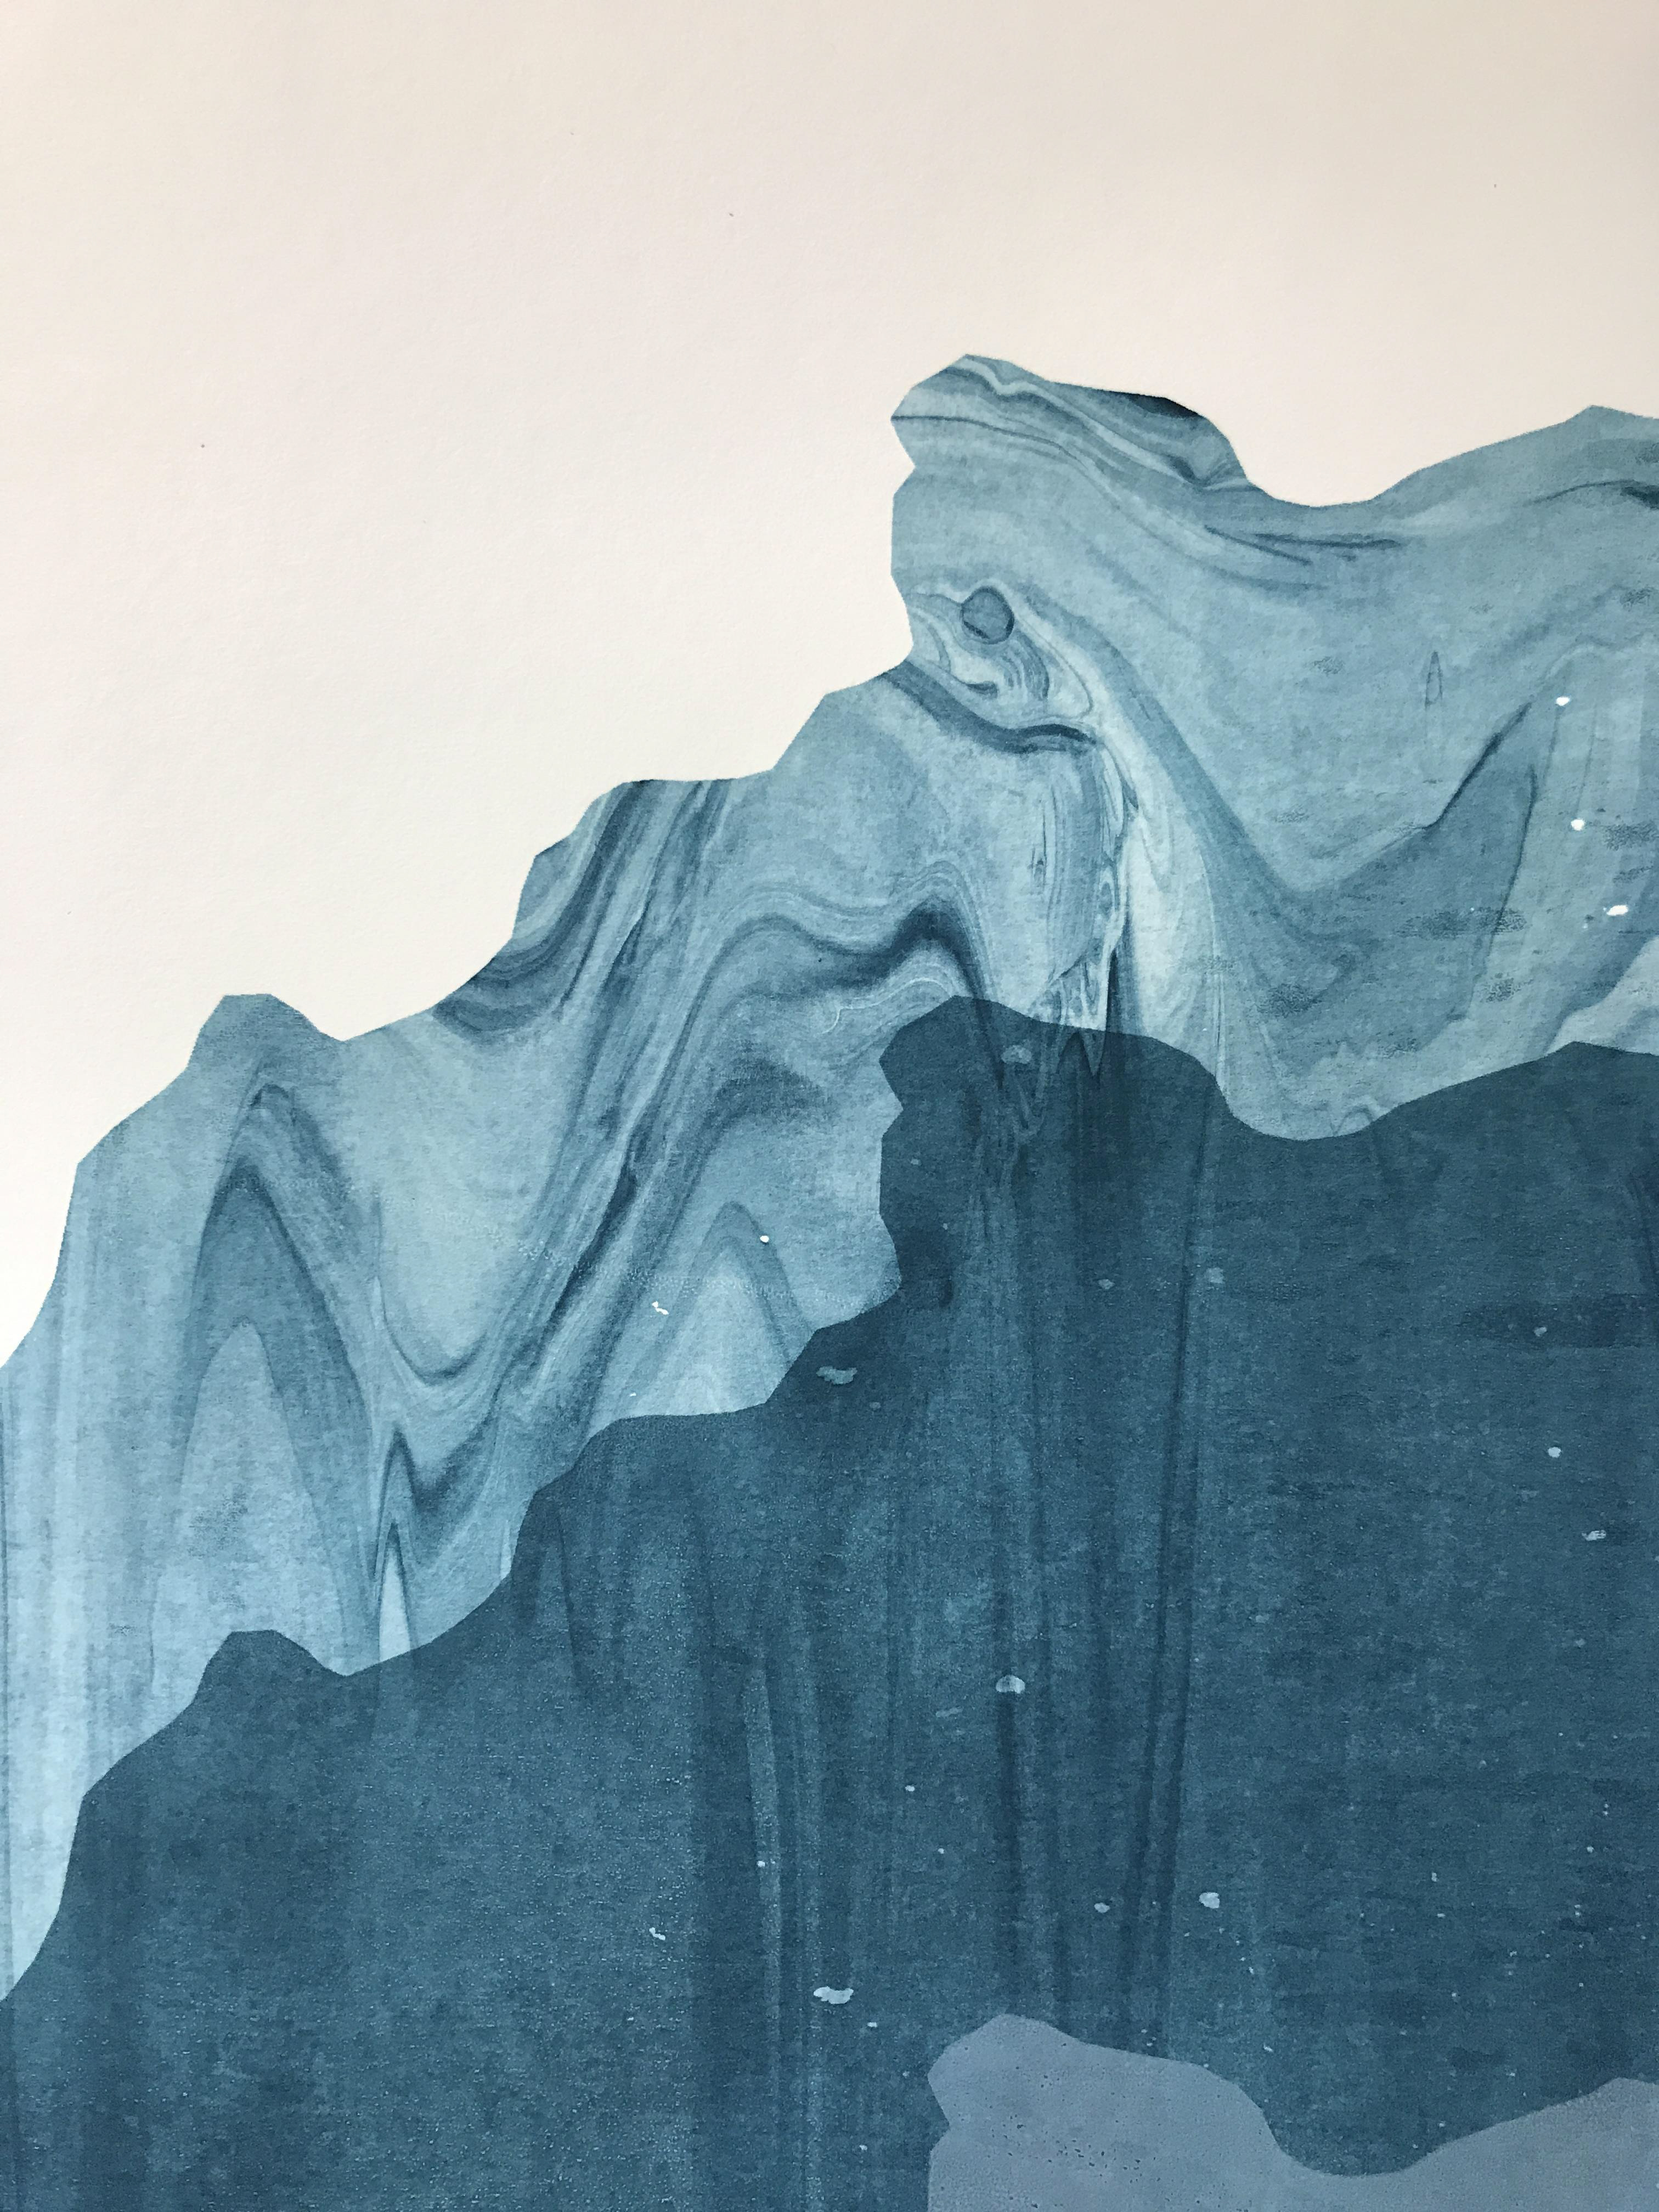
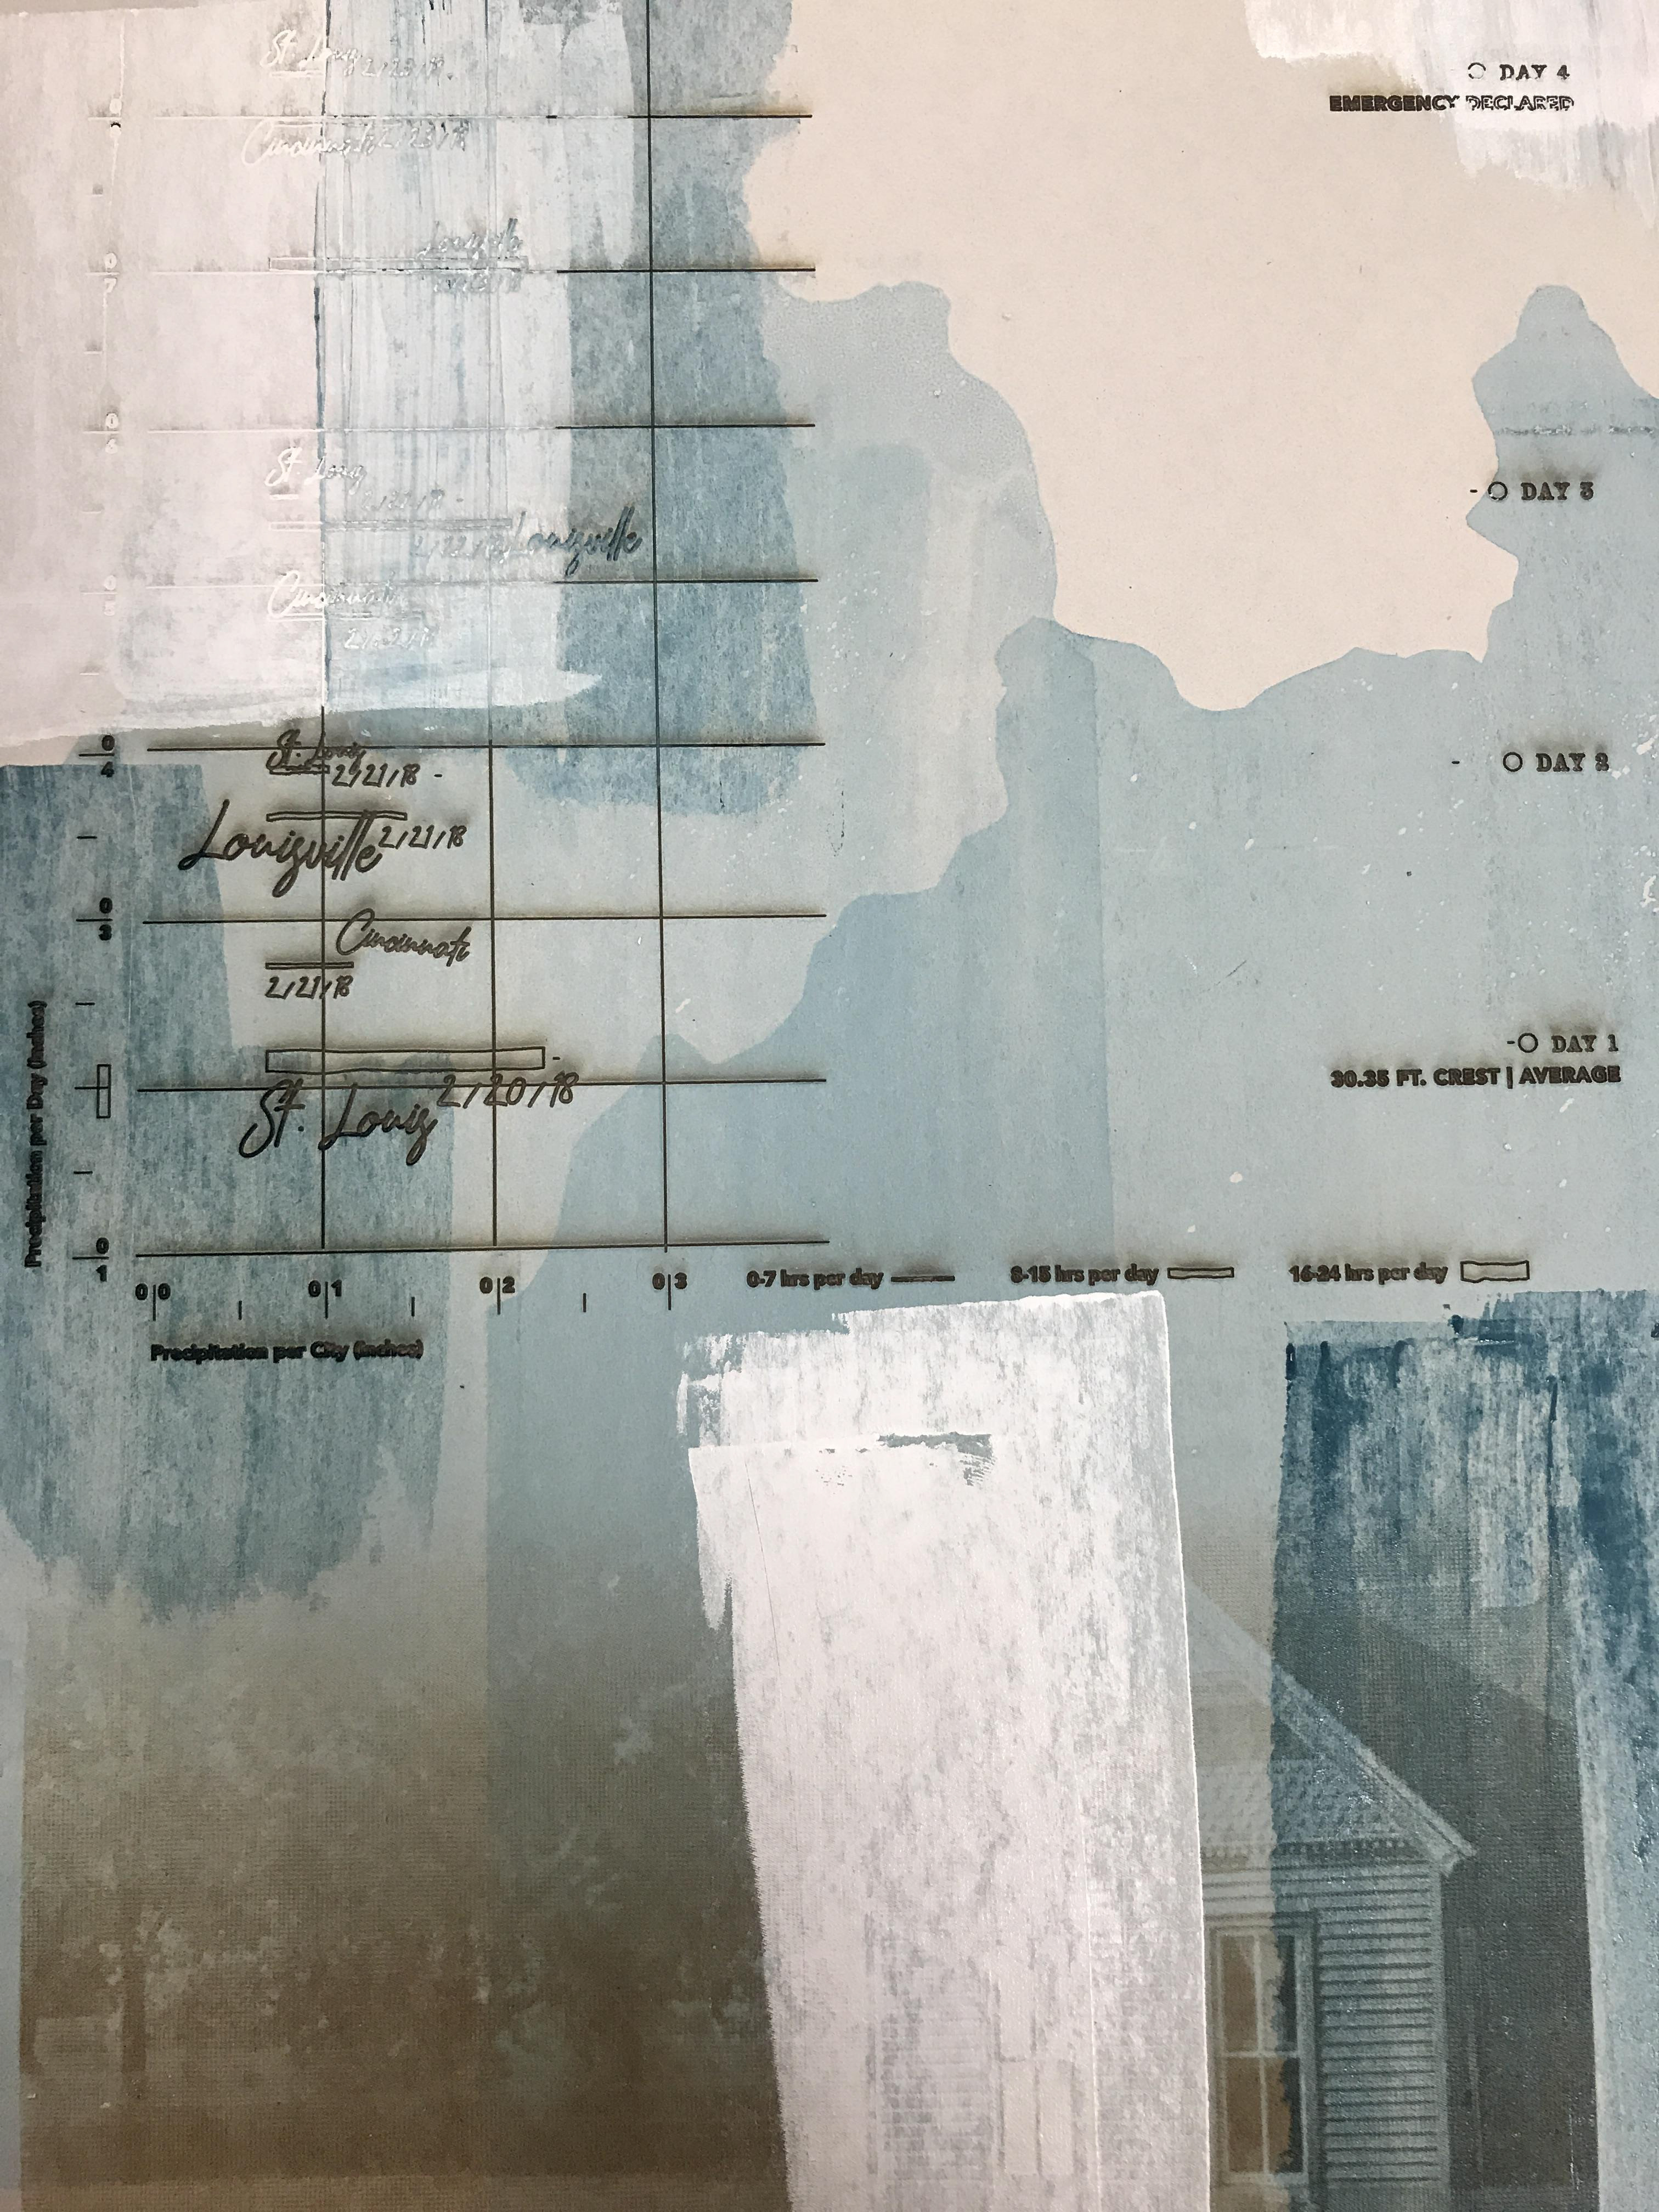
After several trials, mistakes and small victories, I learned many new techniques and created a stand alone piece that represents the data in a permanent way on pieces of walls.