Visualizing complex locomotive data, 10 years, 6 million data points, to aid in informed, high-risk decision making
Client: GE Transportation
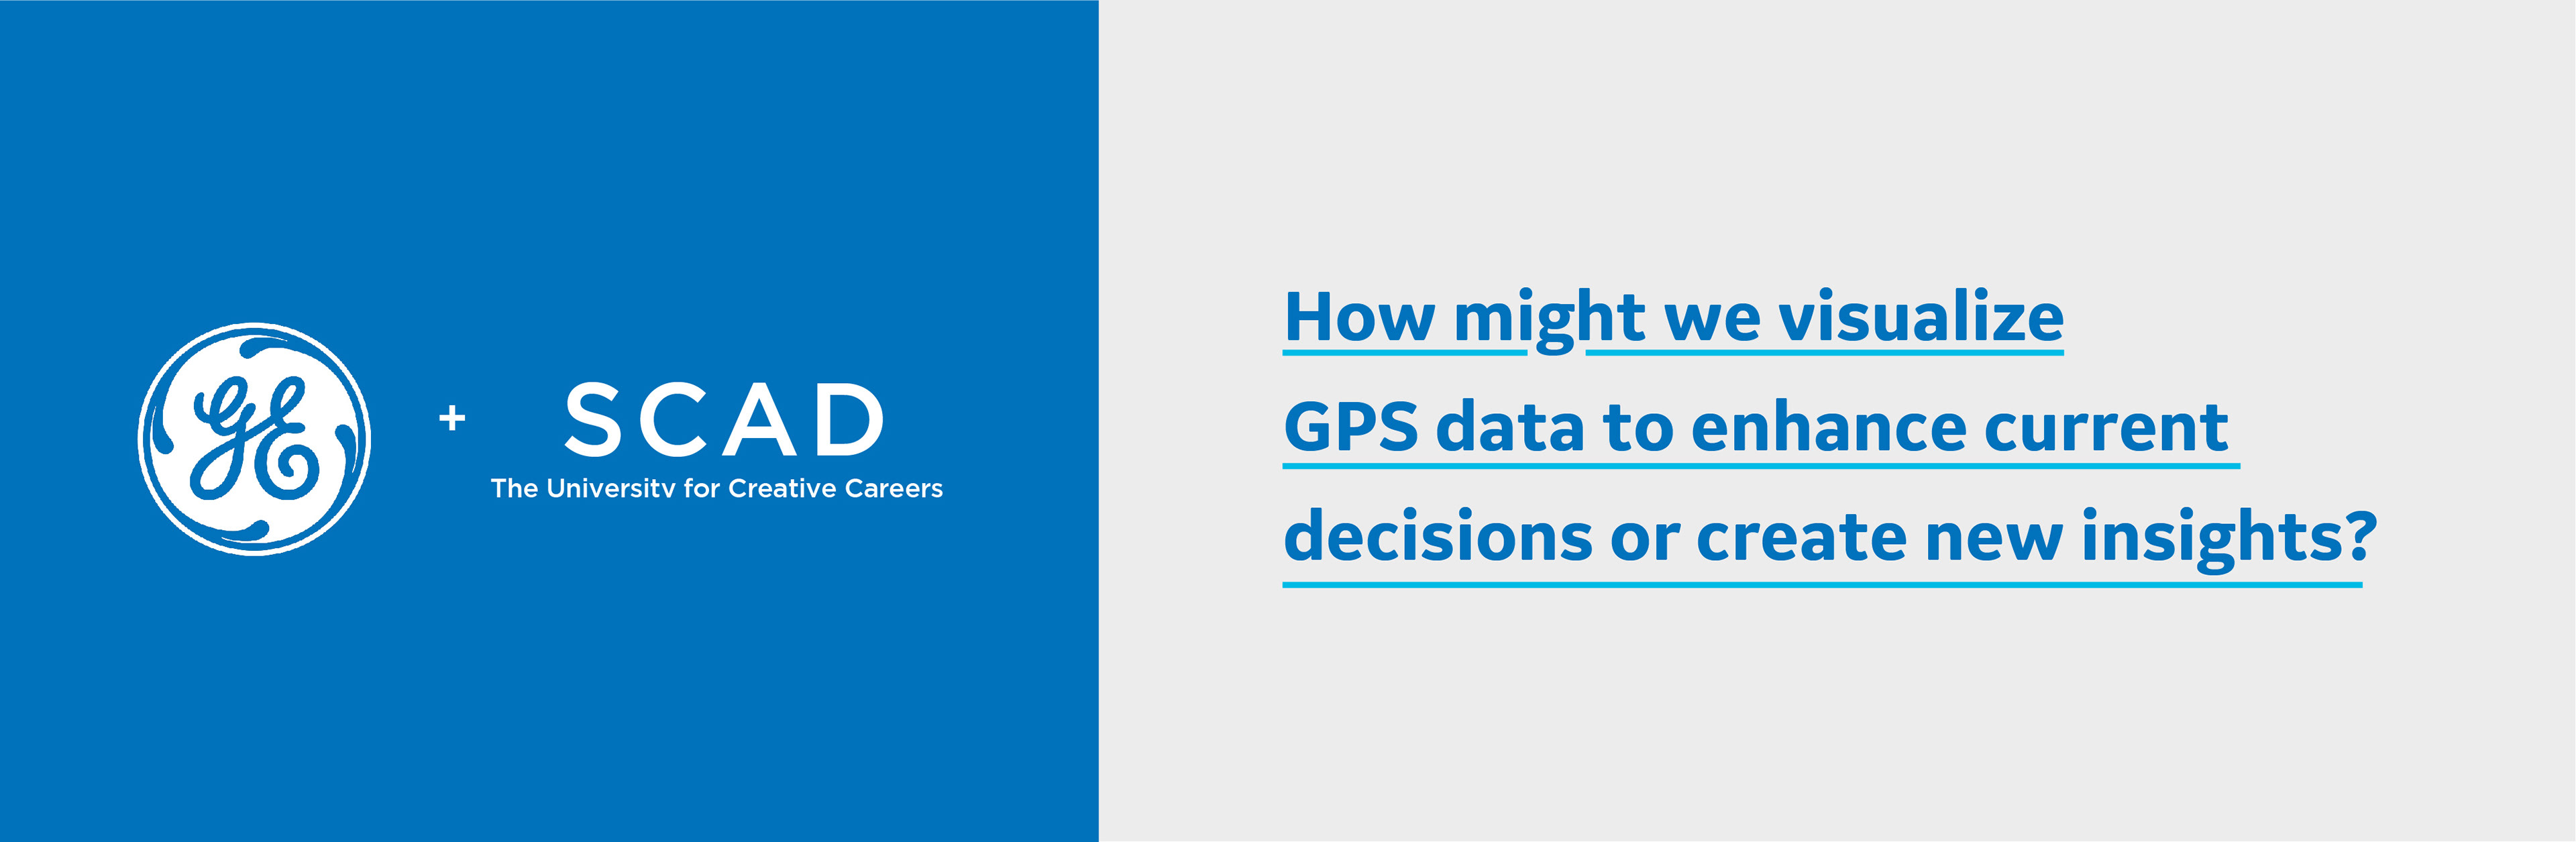
How might we visualize untapped historical GPS data in order to inform future decisions and success at GE Transportation? How might we apply design thinking and strategy to untapped spreadsheets and antiquated dashboards in order to accelerate one of our country’s longest-standing corporations into the future?
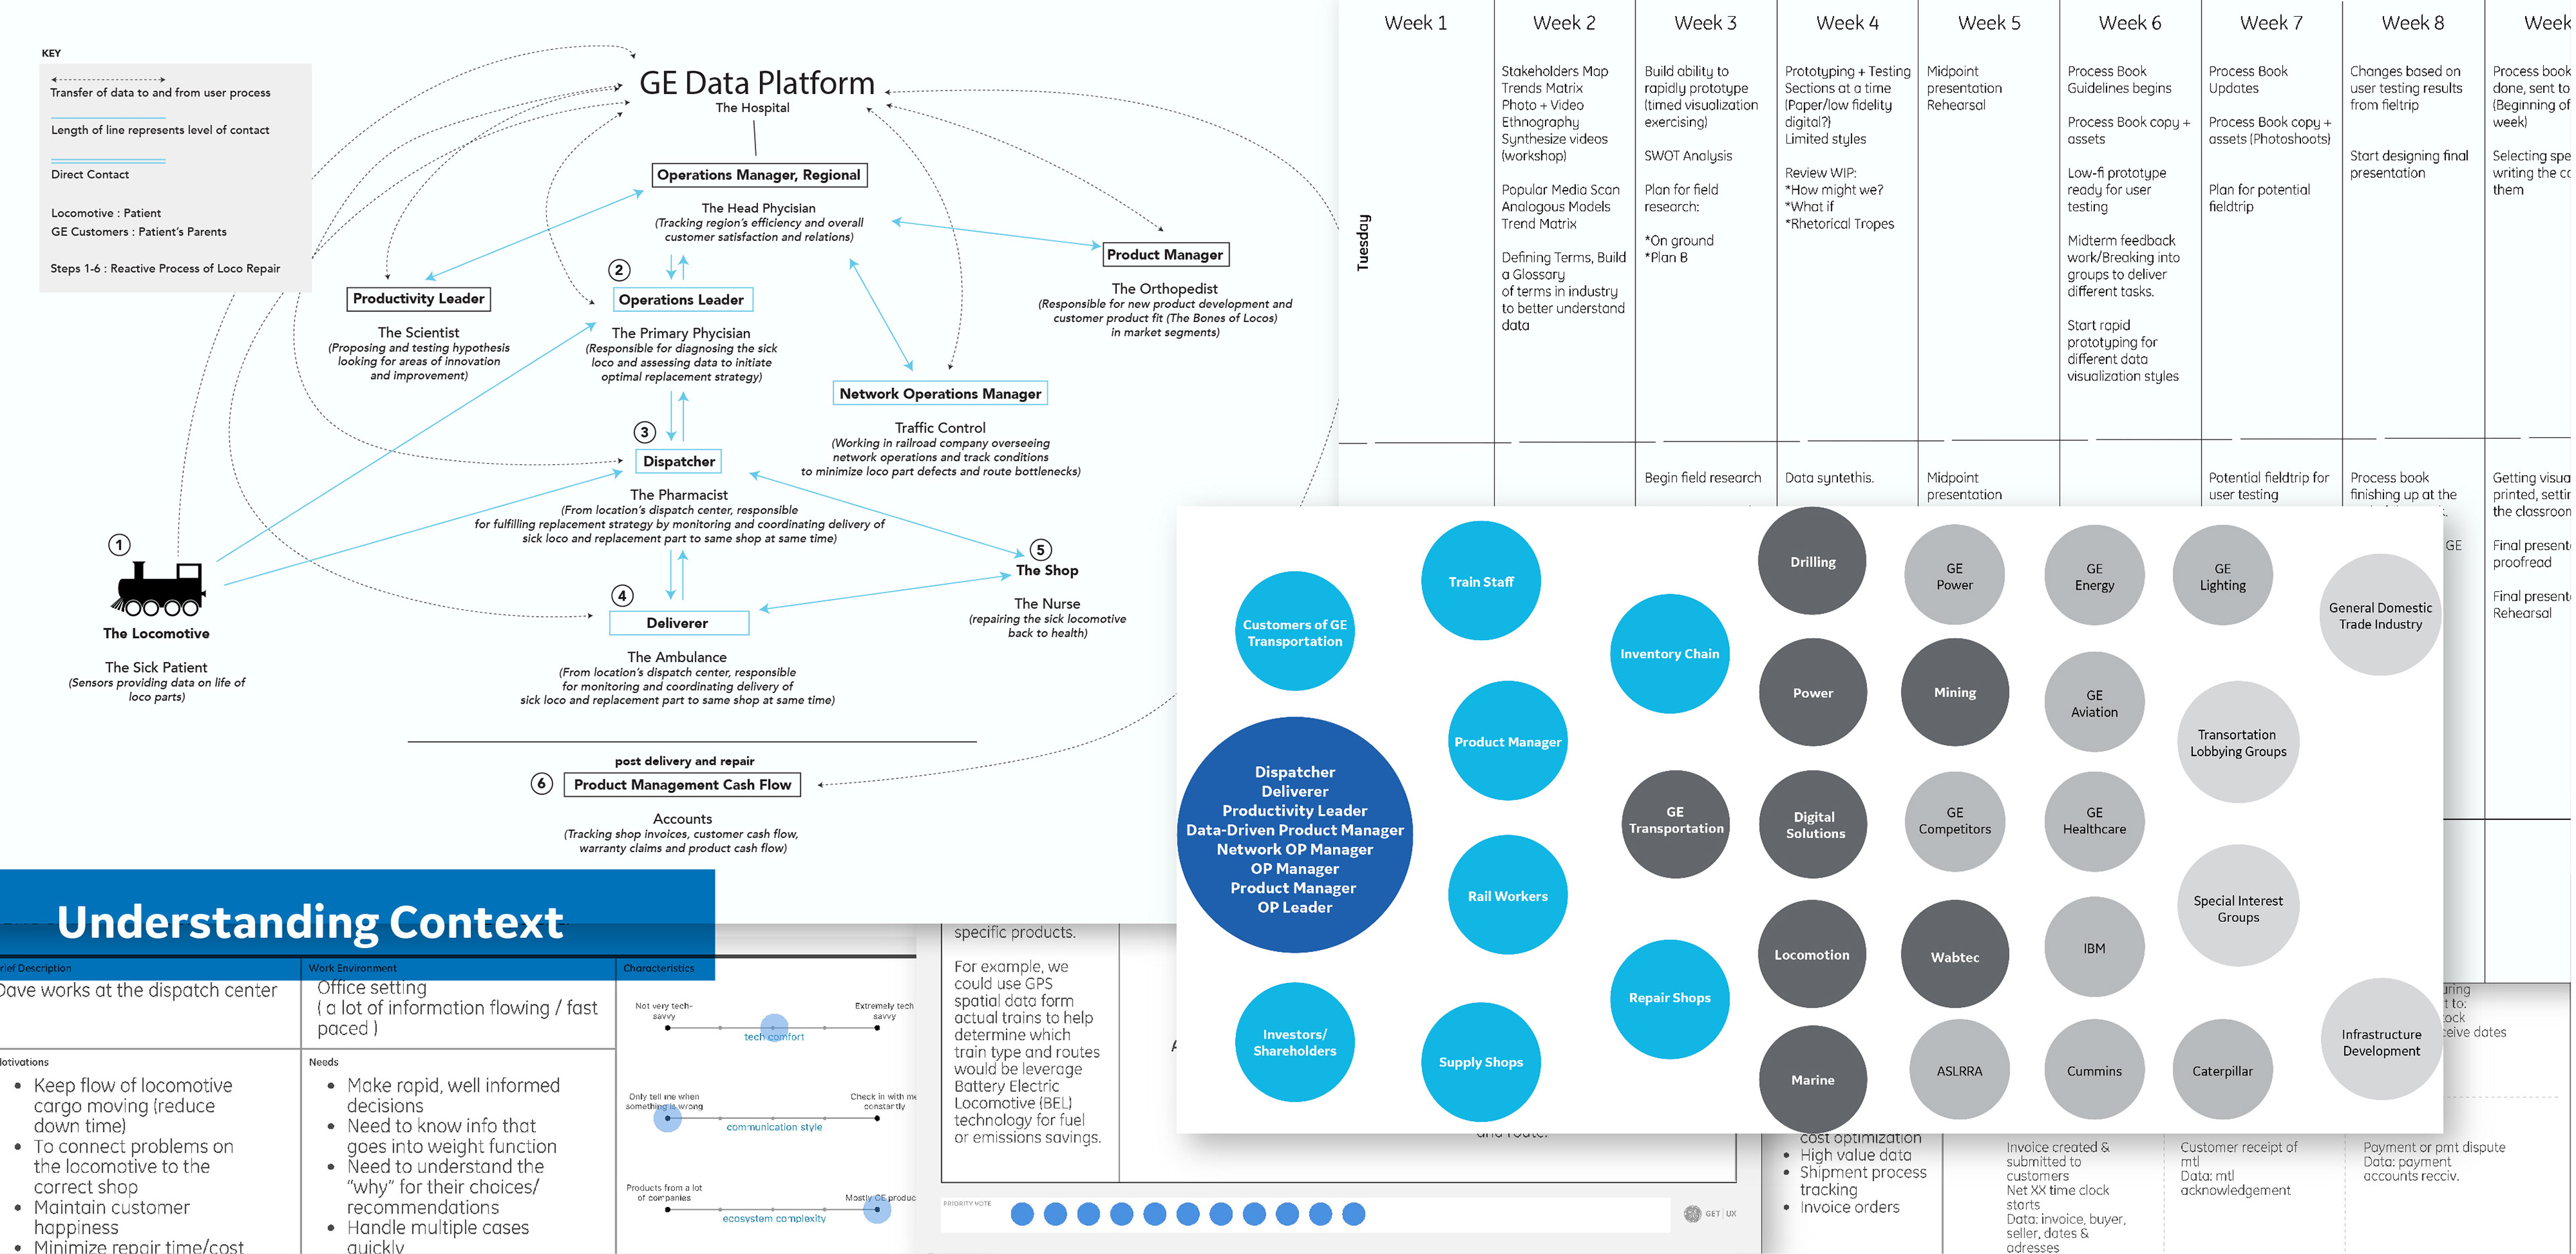
In the search for innovative solutions and competitive advantage, GE Transportation and SCADPro collaborated in an exploration of the complex world of data visualization. Every second for the last 10 years, GE’s locomotive sensors have collected and transmitted data points tracking variables such as part performance, weather and track conditions, barometric pressure and more, all with a valuable common denominator, GPS location coordinates.
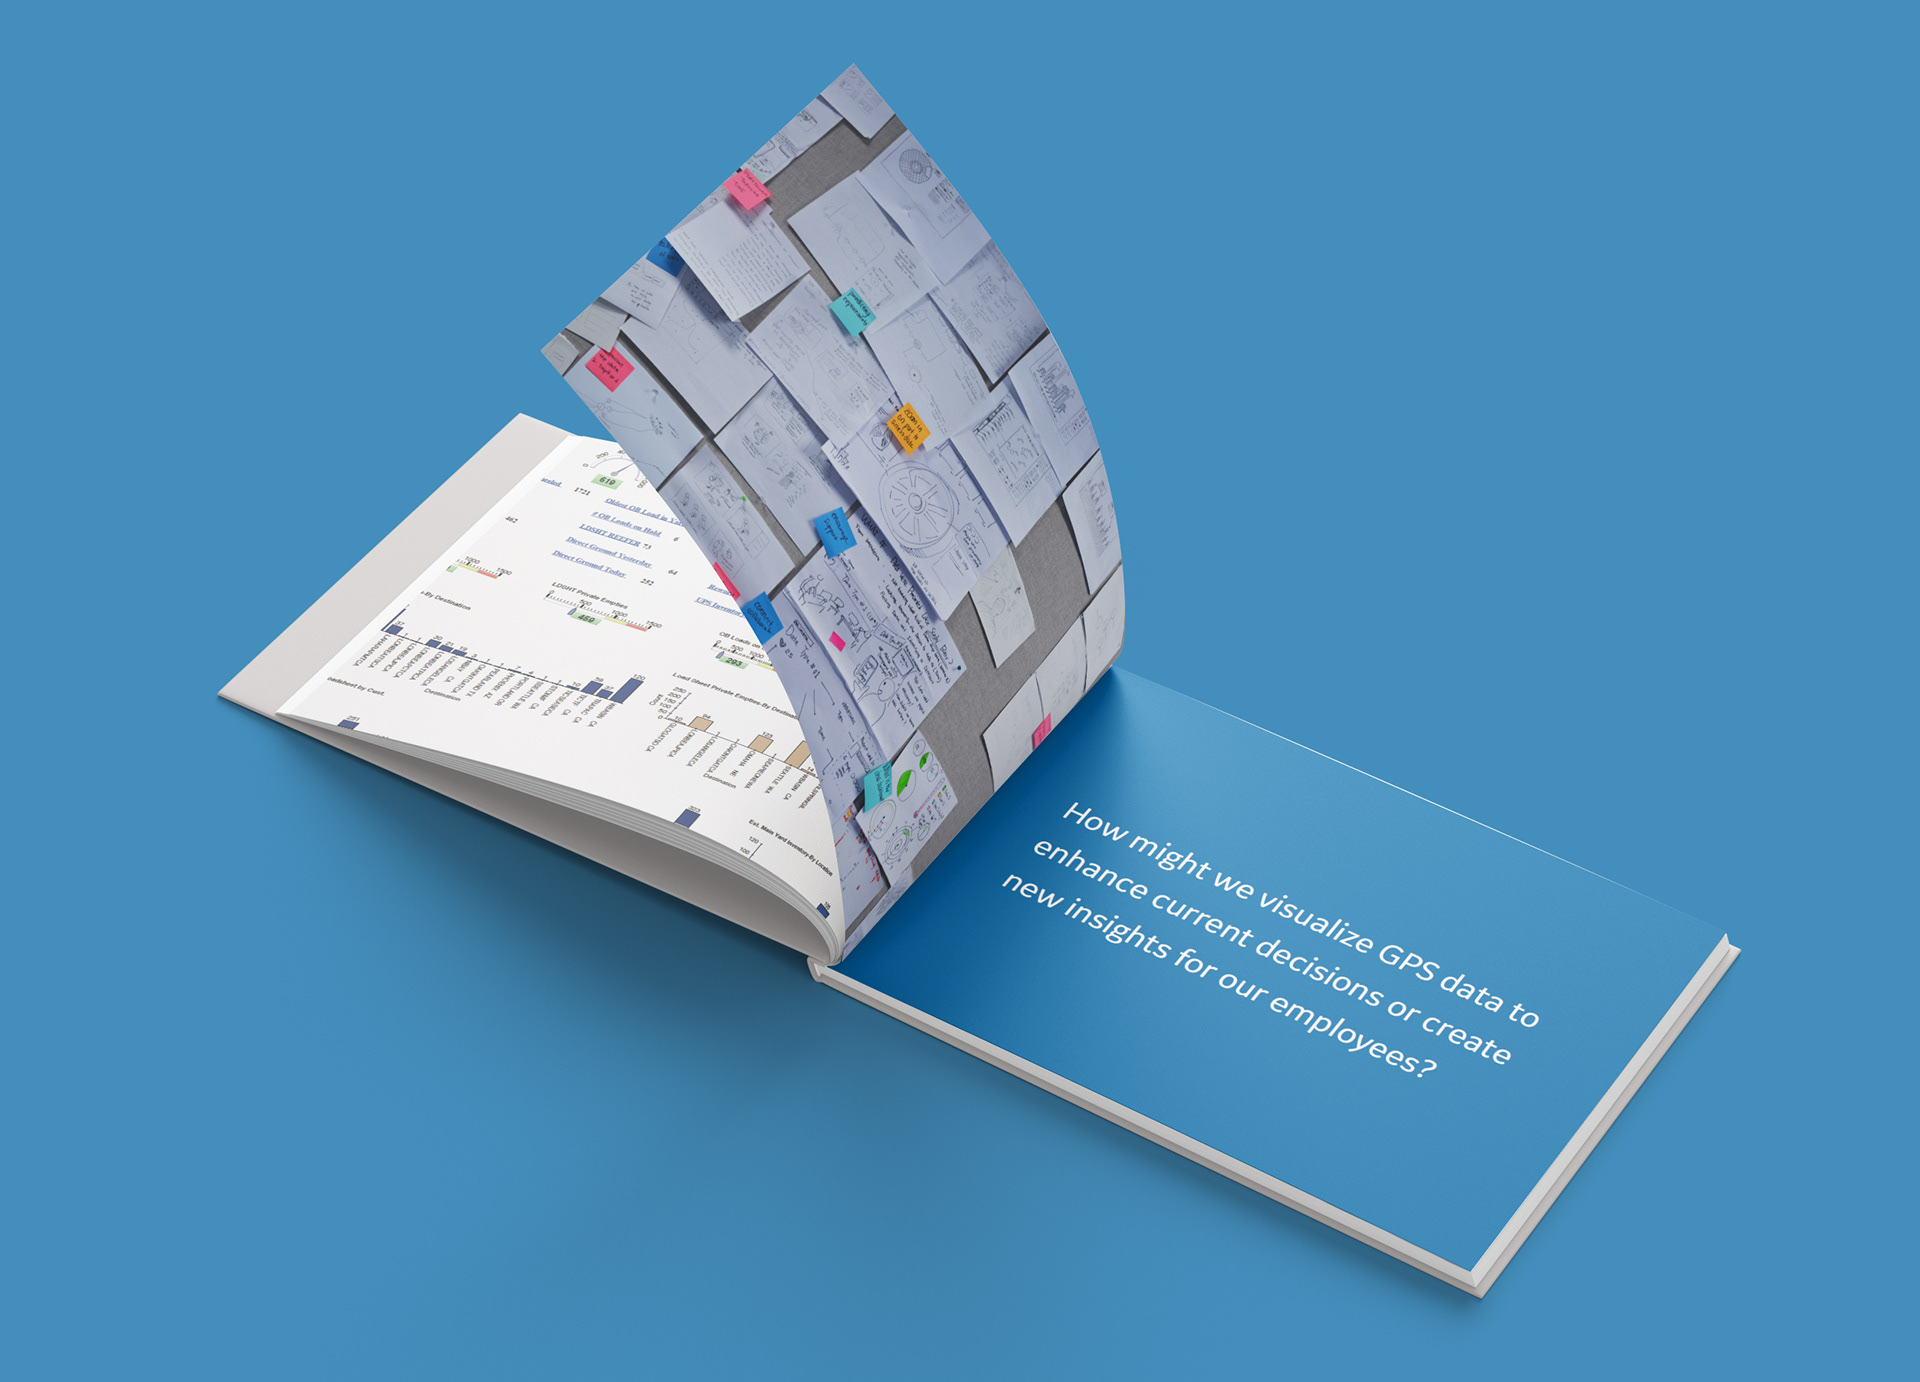
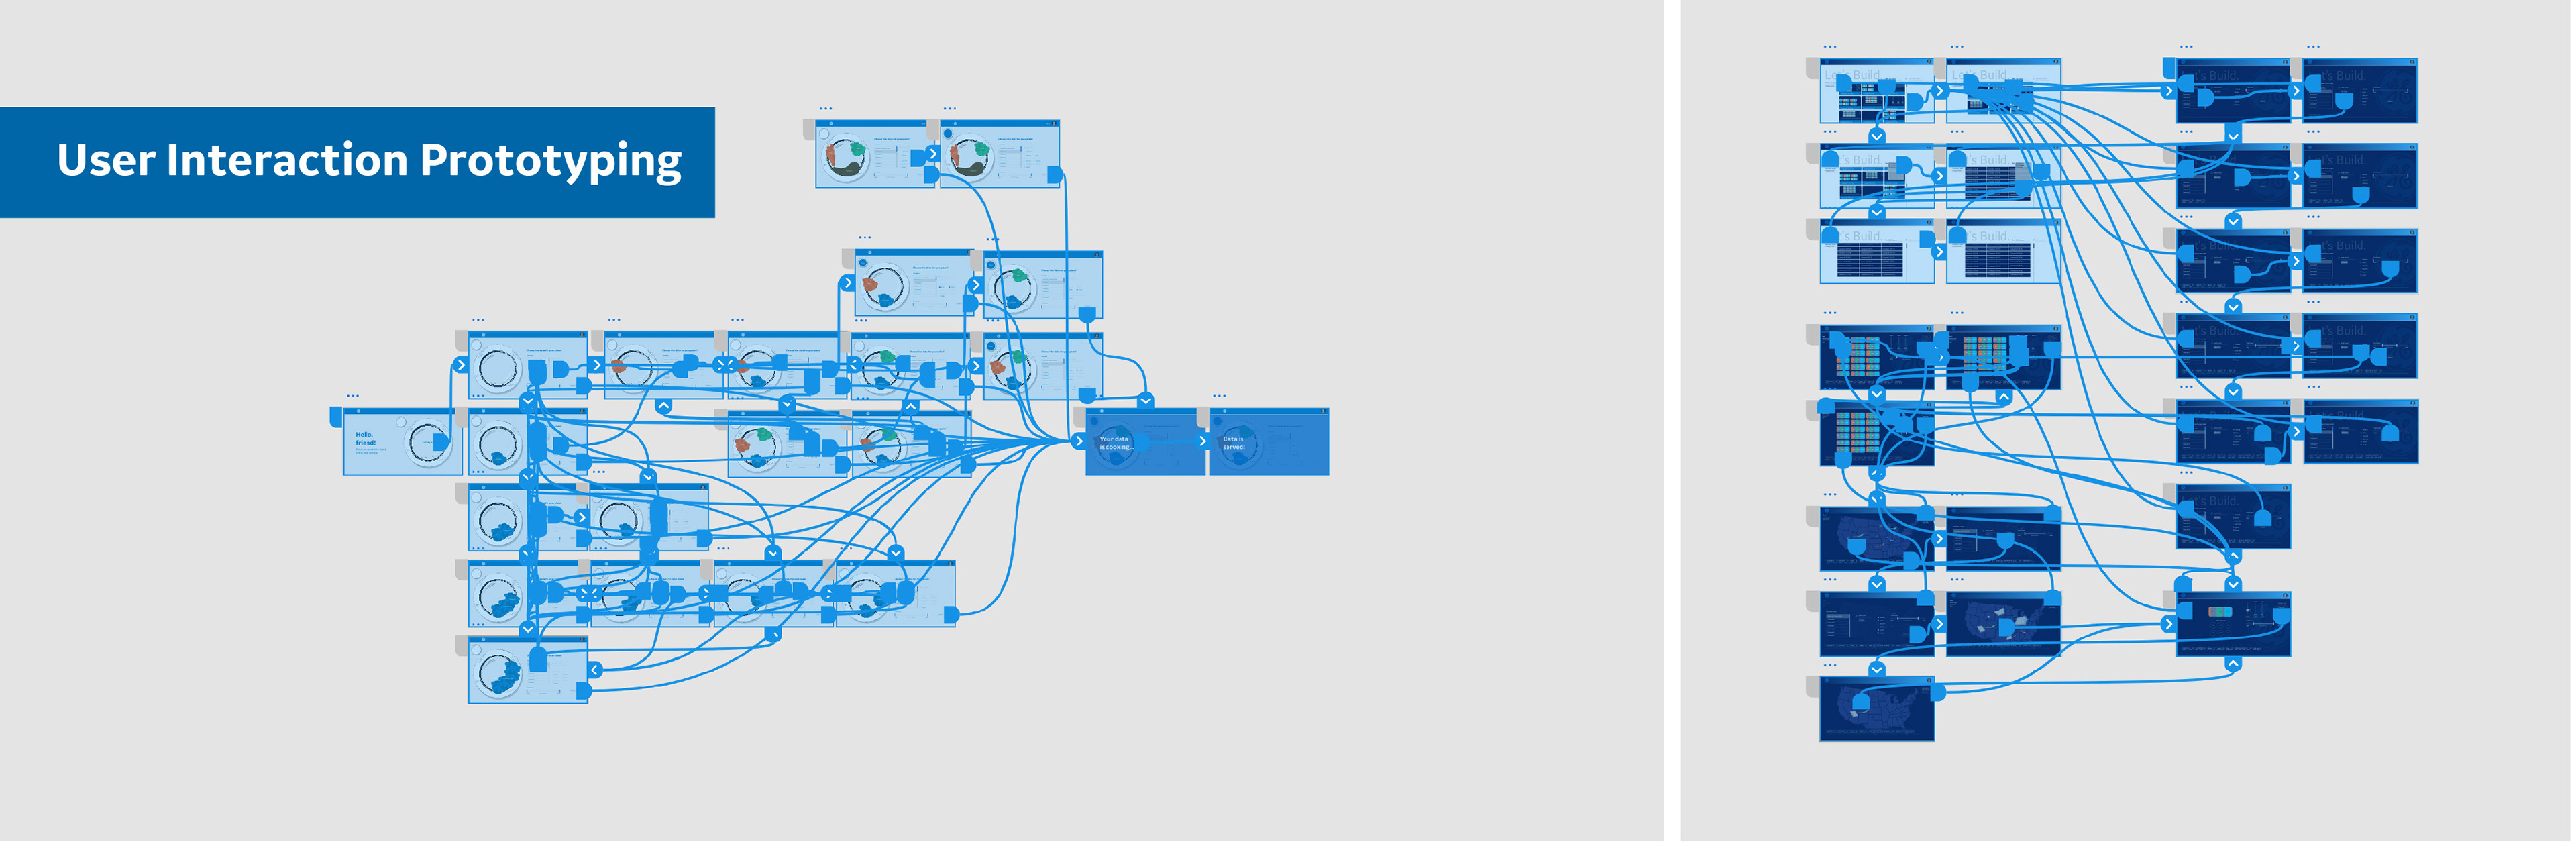
The users of the proposed prototypes are able to see macro and micro trends by zooming in navigating the data spatially. This allows them to identity potential problems and predict future issues to avoid. The root of this project is empowering users to process data that the human mind cannot process without the aid of technology.
The partnership process book outlining research insights, solutions and more
My Part: At the core of data collection and optimization are the humans in which it benefits. Therefore, I personally had three primary goals:
1. Work hard for my teammates and provide support, empathy and encouragement
2. Advocate for the human behind the digital, always ensuring our proposed solutions are built user-up
3. Push my personal capability and understanding of data visualization beyond the expected
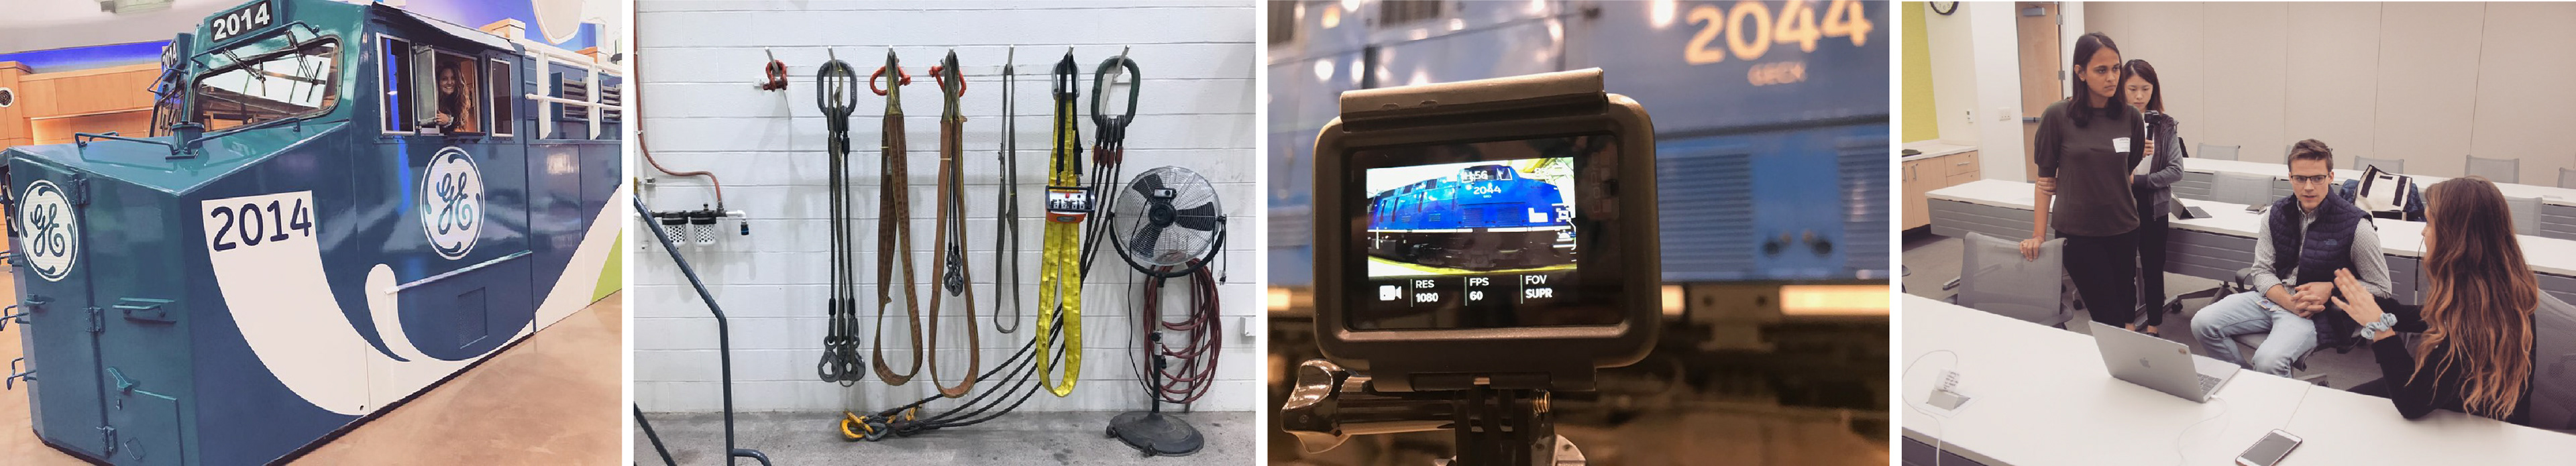
4. Conduct research, user prototyping and user testing in Erie, Pennsylvania

User Testing: When designing complex solutions, it is always important to design with a developed understanding of the environment and tools of those the product is designed for. Conducting user research and testing was vital to the success of this project. We travelled to GE Transportation headquarters in Erie, PE to meet the engineers and locomotive experts behind the organization that keeps this country running.
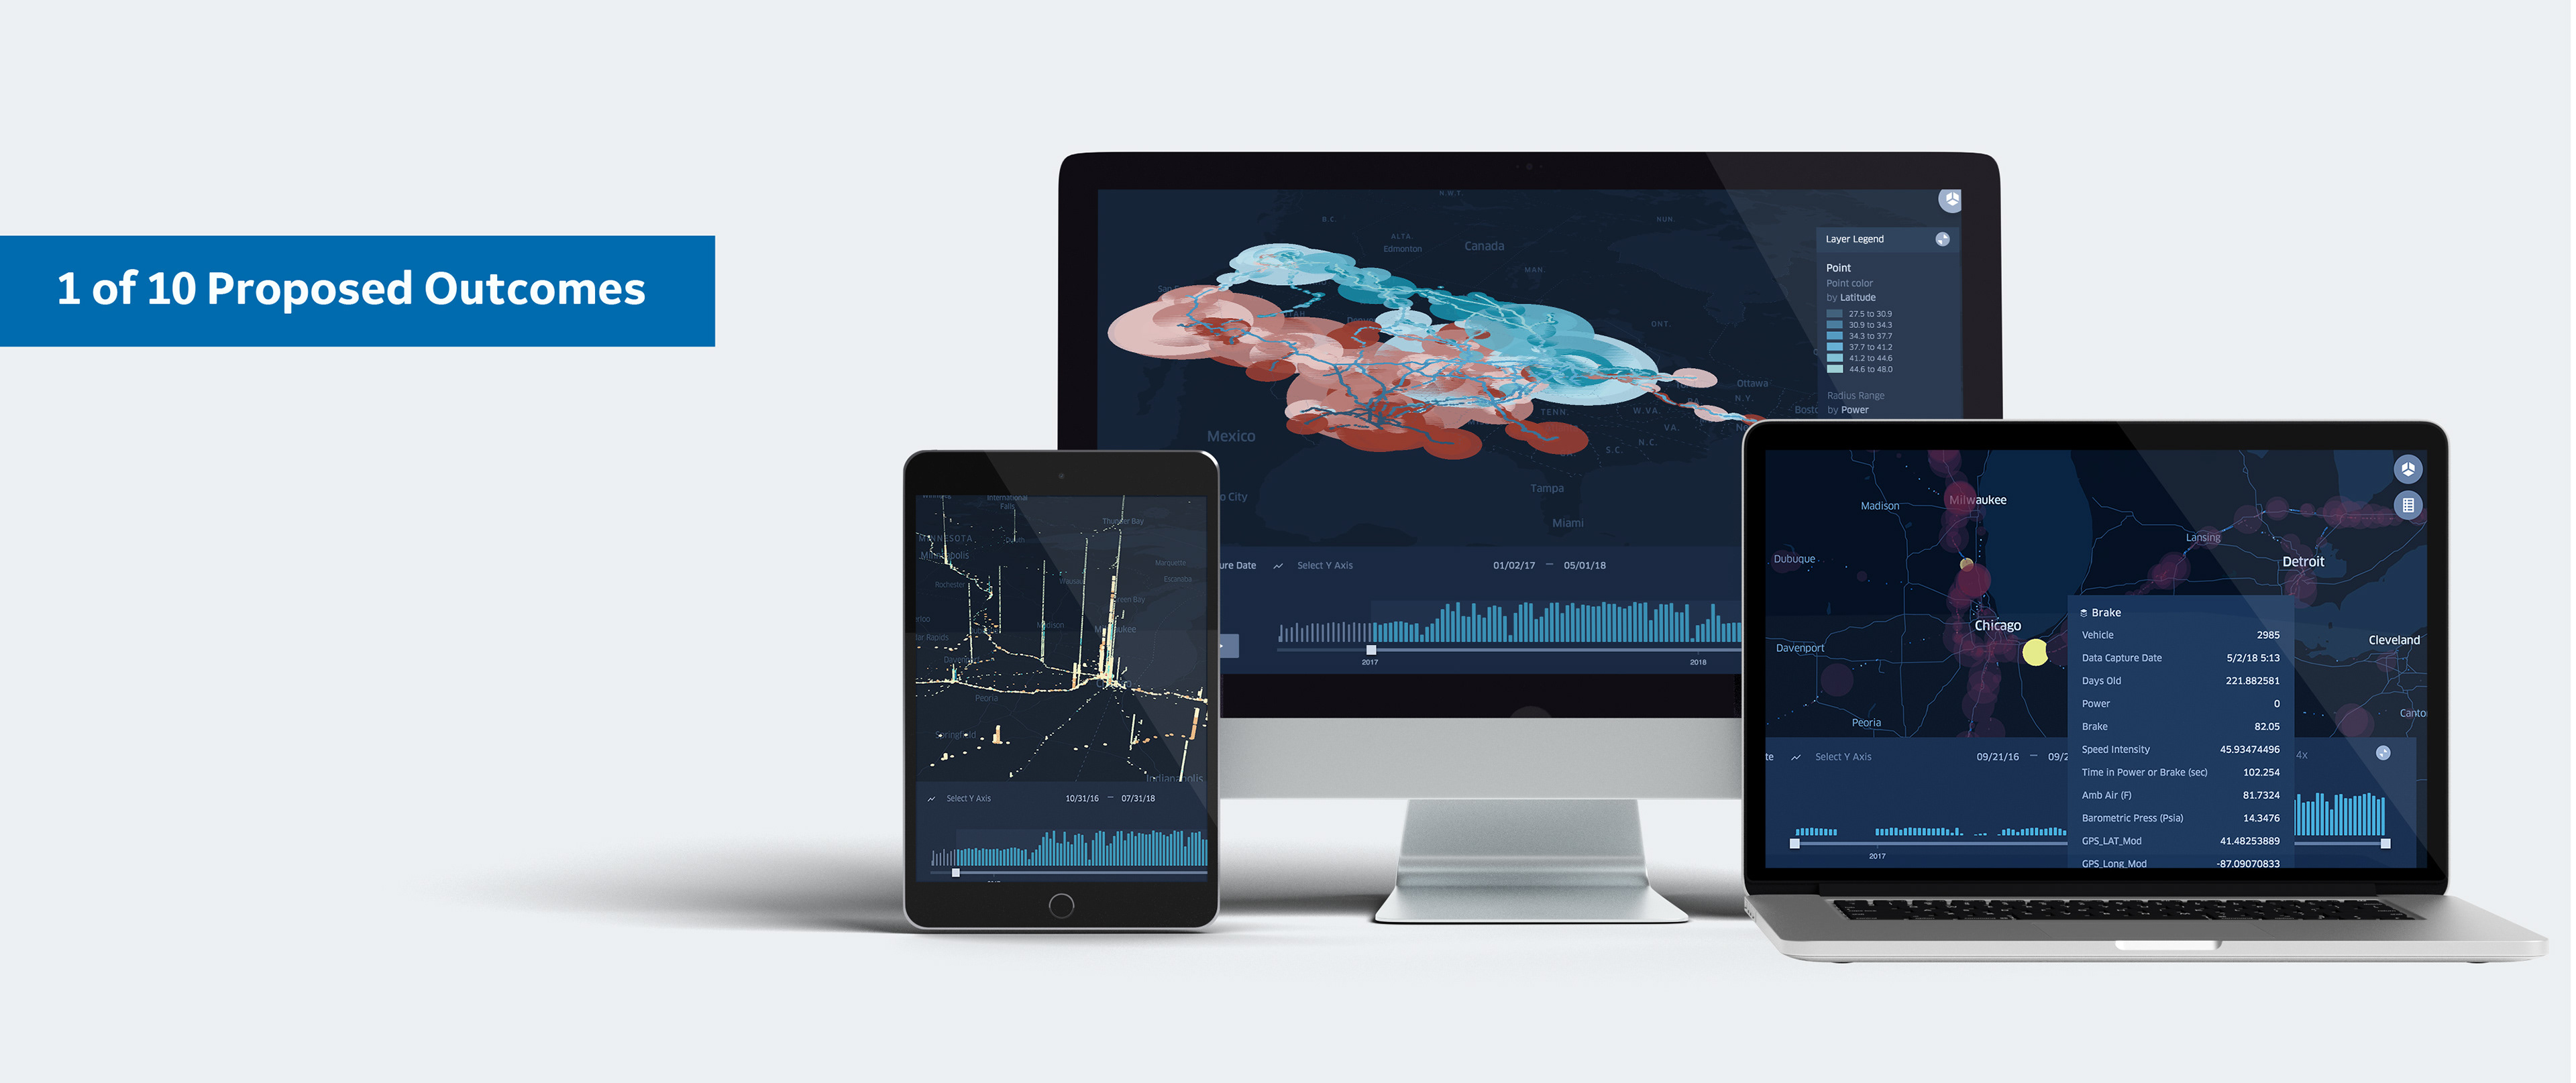
The users of this prototype are able to see macro and micro trends by zooming in navigating the data spatially. This allows them to identity potential problems and predict future issues to avoid.